
Regression Discontinuity Design (RDD): A Simple Explanation
If you’ve ever dipped your toes into the world of data science, economics, or public policy, you’ve likely heard the phrase: “Correlation does not imply causation.”
It’s the golden rule of statistics. Just because two things happen at the same time doesn’t mean one caused the other. But for researchers trying to figure out if a specific program, policy, or medicine actually works, proving causation is the holy grail.
Enter the Regression Discontinuity Design (RDD) .
It sounds intimidating—like something requiring a PhD in mathematics just to pronounce. But the concept is surprisingly intuitive. In fact, you’ve probably experienced it in your own life without realizing it.
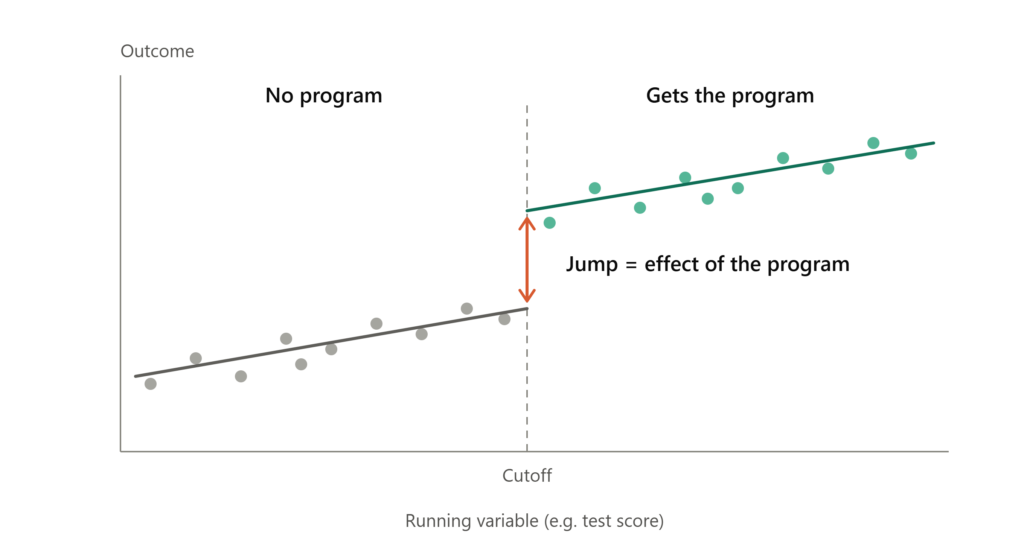
Here is a simple explanation of how RDD works, why researchers love it, and how it helps us separate fact from fiction.
The “Cutoff” Concept
Imagine you are a student. To get a scholarship, you need to score at least 80 points on a final exam.
- Student A scores an 81 and gets the scholarship.
- Student B scores a 79 and does not.
Now, fast forward four years. You want to know: Did the scholarship cause Student A to graduate with a better GPA than Student B?
On the surface, comparing them is unfair. Student A is likely smarter or more hardworking (they scored higher, after all). But here is the magic of RDD: Just around the cutoff point, the two groups are virtually identical.
Think about it. Is a student who scored 79 really that different from a student who scored 81? Probably not. They likely have similar intelligence, similar study habits, and similar backgrounds. The only real difference is that one crossed an arbitrary line, and the other didn’t.
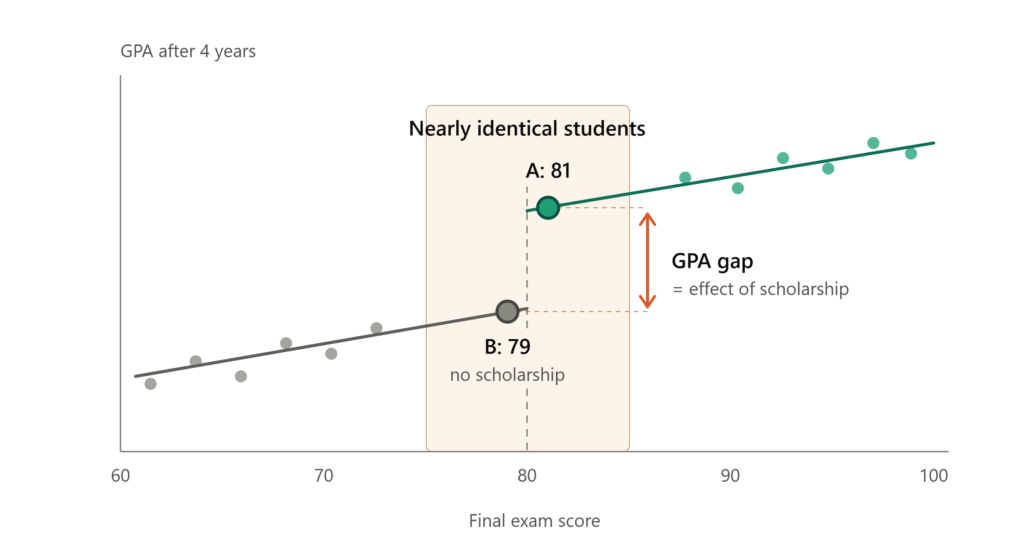
RDD exploits this line.
By comparing people who are just barely above the cutoff to those who are just barely below it, researchers can treat the situation almost like a randomized controlled trial. The “treatment” (getting the scholarship) is essentially assigned randomly to those near the threshold.
How It Works (The “Jump”)
In statistical terms, RDD looks for a “discontinuity” —or a jump—in the data at the cutoff point.
If we plotted our students on a graph with their exam scores on the X-axis and their future GPAs on the Y-axis, we would see a line sloping upward (smarter students tend to get better GPAs). But at the 80-point mark, we would look for a sudden jump in the line.
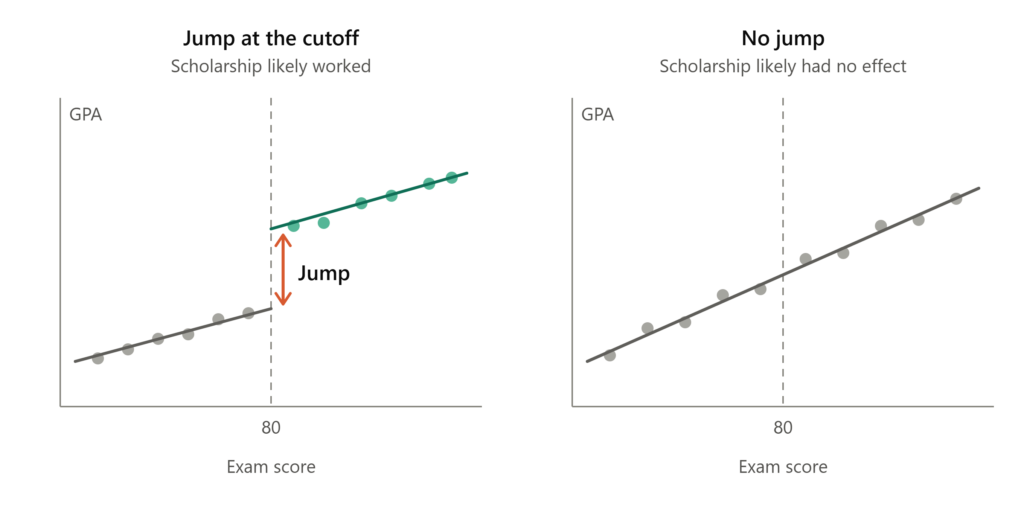
- If there is a jump at 80, it suggests the scholarship actually caused the increase in GPA.
- If the line continues smoothly through 80 with no jump, the scholarship likely had no effect.
RDD is the art of looking for that jump.
Why Researchers Love It
RDD has become incredibly popular in recent years (leading to a Nobel Prize in Economics for Guido Imbens and Joshua Angrist in 2021) for three main reasons:
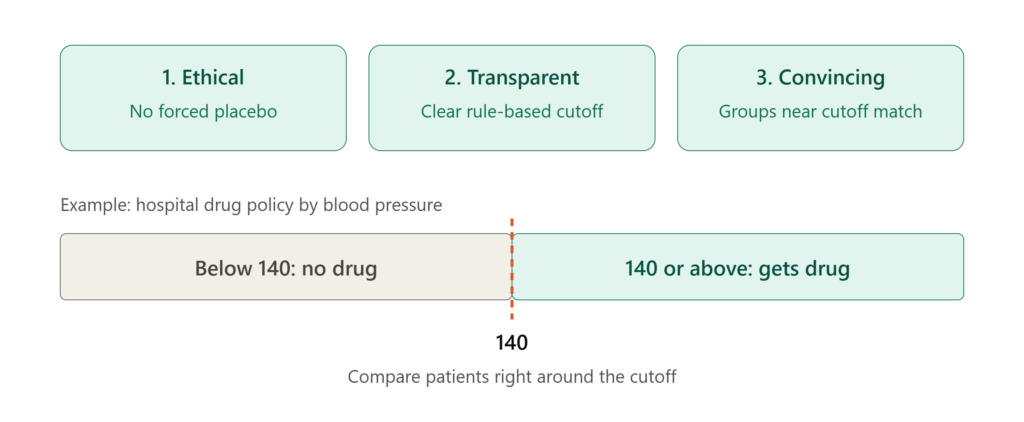
- It’s Ethical: You can’t randomly assign half of a group of sick people to receive a life-saving drug and the other half to receive a placebo. But if a hospital policy says “only patients with blood pressure over 140 get the drug,” you can use RDD to study the patients right around that 140 mark.
- It’s Transparent: The rules are usually clear. Either you get the benefit or you don’t, based on a specific score.
- It’s Convincing: Because the groups near the cutoff are so similar, it provides strong evidence for cause and effect.
Real-World Examples
RDD isn’t just for scholarships. It’s used everywhere:
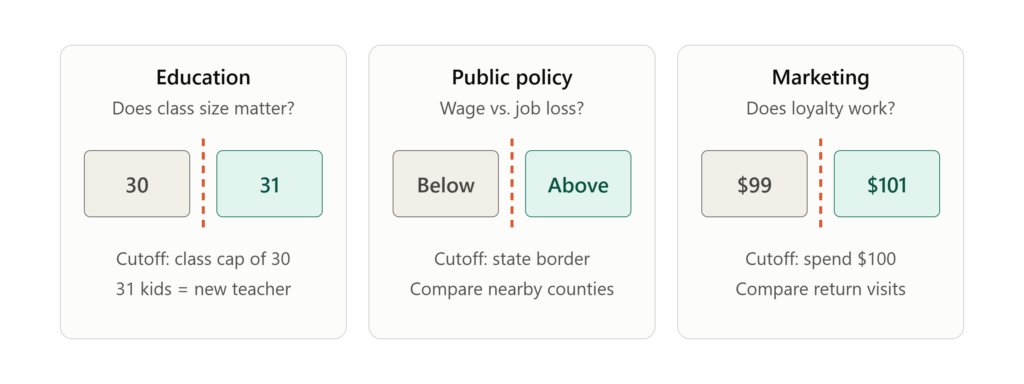
- Education: Does class size matter? Researchers look at schools with a strict cap of 30 students per class. They compare a class with 30 kids to a class with 31 kids (which requires a new teacher). Since the kids are similar, any difference in test scores is likely due to the class size.
- Public Policy: Does a higher minimum wage cause job loss? Researchers might compare employment rates in counties where the minimum wage is just above a state border versus just below it.
- Marketing: Does a loyalty program work? A company might offer a free gift to anyone who spends over $100. RDD can compare customers who spent $99 vs. $101 to see if the gift actually made them return to the store.
The Catch
While RDD is powerful, it has one major limitation: It only tells you about the people near the cutoff.
In our scholarship example, RDD tells us the effect of the scholarship on students with scores between, say, 75 and 85. It does not tell us how a student with a score of 50 would react to the scholarship, or how a genius with a score of 100 would react.
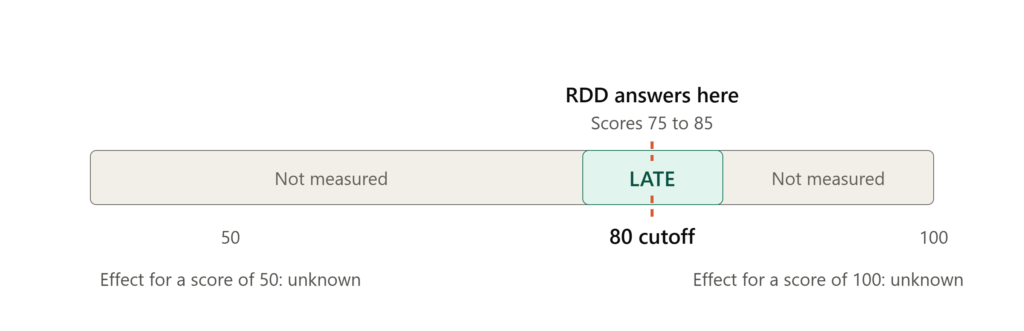
It provides a “Local Average Treatment Effect” (LATE). It’s hyper-specific, but it’s also hyper-accurate for that specific group.
The Bottom Line
Regression Discontinuity Design is essentially a way of finding a natural experiment in a messy world. It relies on the idea that sometimes, the best way to compare two groups is to look at the people standing right on the border between them.
So, the next time you hear about a policy based on a “threshold” or a “cutoff,” remember RDD. It’s the statistical tool that turns arbitrary rules into valuable data.
Have you encountered RDD in your field of work? Share your thoughts in the comments below!