
Understanding the Bootstrapping Method in Statistics
If you’ve ever dipped your toes into the world of data science or statistics, you know that the ultimate goal is often inference. We want to take a small sample of data and use it to make big claims about the entire population.
Traditionally, we rely on formulas Central Limit Theorem, t-tests, z-scores to calculate confidence intervals and p-values. These methods work beautifully, provided you meet certain assumptions: your data must be normally distributed, your sample size must be large enough, and the underlying distribution must be known.
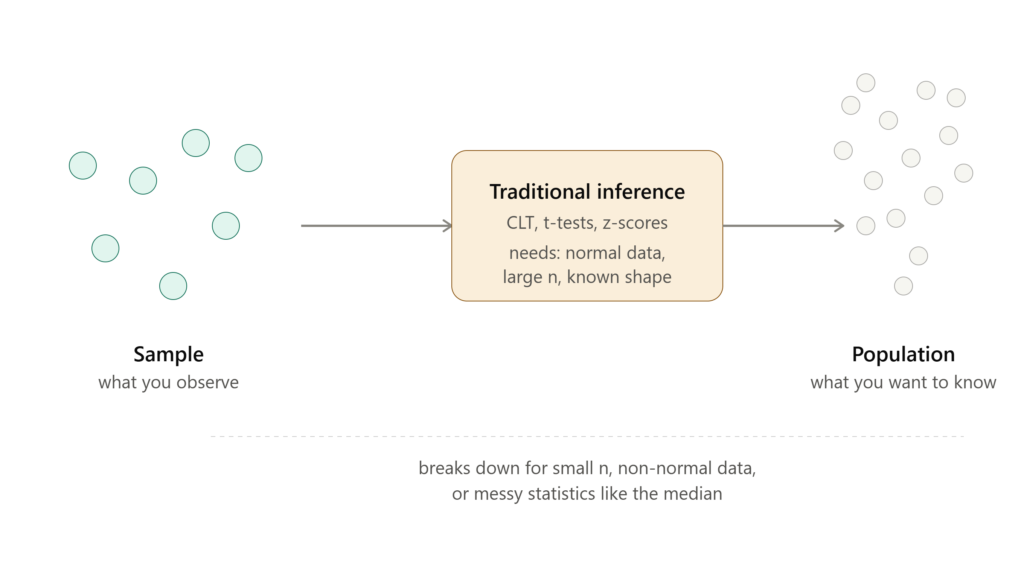
But what happens when your data isn’t normal? What happens when you have a small sample size, or you’re trying to estimate a complex statistic like the median or a correlation coefficient, where standard formulas get messy?
What is Bootstrapping?
At its core, bootstrapping is a computer-intensive resampling technique used to estimate the sampling distribution of a statistic by resampling with replacement from the original data.
The name comes from the phrase “to pull oneself up by one’s bootstraps,” referencing the idea that we are using the data itself to generate new data, without relying on external assumptions.
The Core Concept in 3 Steps
Imagine you have a dataset of 100 people’s heights. You want to know the average height of the entire population, but you only have these 100 people.
Here is how the bootstrap works:
- Resample: Take your original dataset of 100 people. Randomly select 100 people from this group, but with replacement. This means you could pick the same person multiple times. This creates a new “bootstrap sample.”
- Calculate: Calculate the statistic you are interested in (e.g., the mean height) for this new bootstrap sample.
- Repeat: Repeat steps 1 and 2 thousands of times (e.g., 10,000 iterations). You now have 10,000 different estimates of the mean.
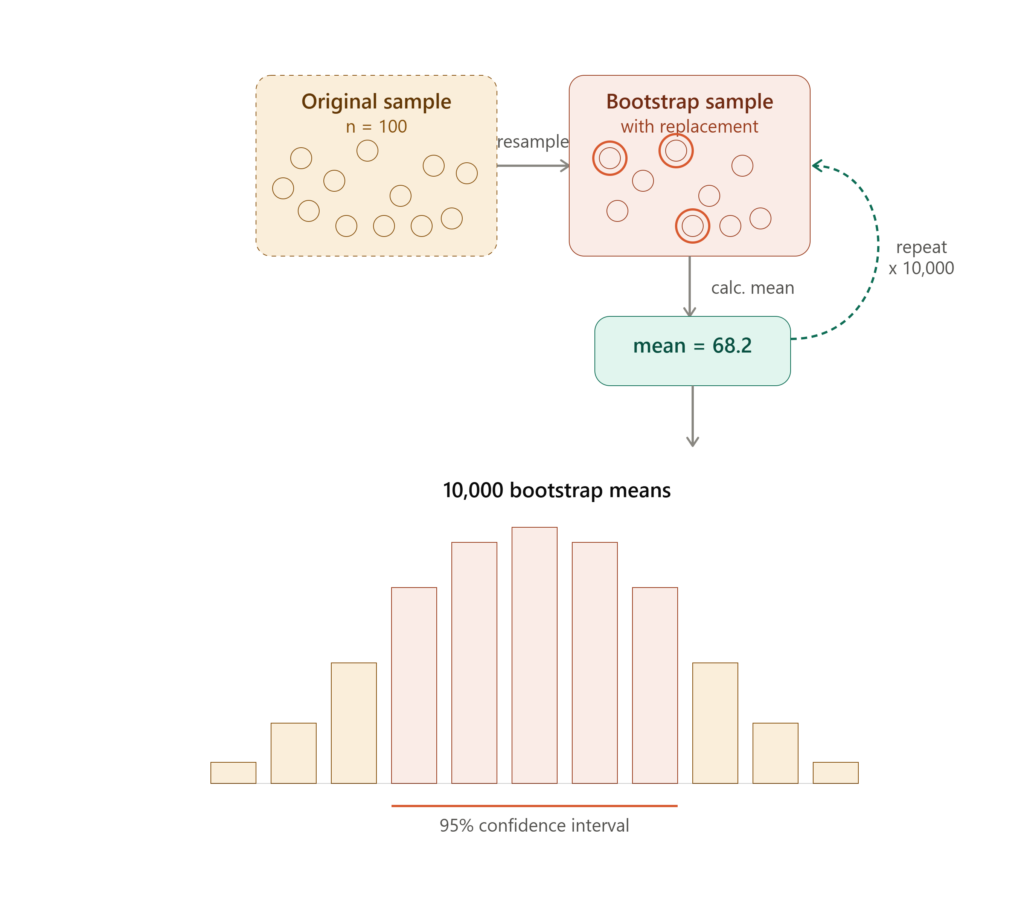
By looking at the distribution of these 10,000 estimates, you can construct confidence intervals and understand the variability of your statistic.
Why Use Bootstrapping? (The “Why Bother?”)
You might be thinking, “Why simulate data when I have real data?” Here is why bootstrapping is a powerhouse in modern statistics:
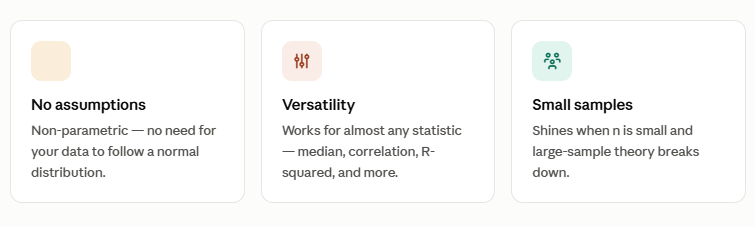
- No Assumptions: It is non-parametric. You don’t need to assume your data follows a Normal (Bell Curve) distribution.
- Versatility: It works for almost any statistic. Want to know the confidence interval for the median? The correlation coefficient? The R-squared of a regression? Bootstrapping handles them all easily.
- Small Samples: It is incredibly useful when you have a small sample size and standard asymptotic theory (which relies on large samples) fails.
Real-World Applications of Bootstrapping
Bootstrapping isn’t just an academic exercise; it is used heavily in industry and research.
1. Machine Learning & Model Evaluation
When building predictive models, we need to know how well they will perform on unseen data. Bootstrapping is used to estimate the accuracy of a model. By resampling the test set, data scientists can get a robust measure of how the model’s error rate might fluctuate.
Fun fact: The popular “Random Forest” algorithm uses a variation of bootstrapping (called Bagging) to create multiple decision trees.
2. Finance and Risk Management
Financial markets are notoriously non-normal (they have “fat tails”). A standard deviation calculation might underestimate risk. Analysts use bootstrapping to simulate thousands of possible market scenarios to calculate Value at Risk (VaR) and understand potential portfolio losses.
3. Biology and Medicine
In clinical trials, sample sizes are often small due to ethical or cost constraints. Bootstrapping allows researchers to estimate the reliability of a new drug’s effectiveness without needing thousands of patients. It is also used in genomics to analyze gene expression data.
4. A/B Testing
Tech companies run thousands of A/B tests. Sometimes, the data is skewed (e.g., revenue per user, where most users spend \$0 but a few spend thousands). Bootstrapping allows analysts to compare the medians or trimmed means of two groups reliably, without the data being distorted by outliers.
A Word of Caution
While bootstrapping is powerful, it isn’t magic.
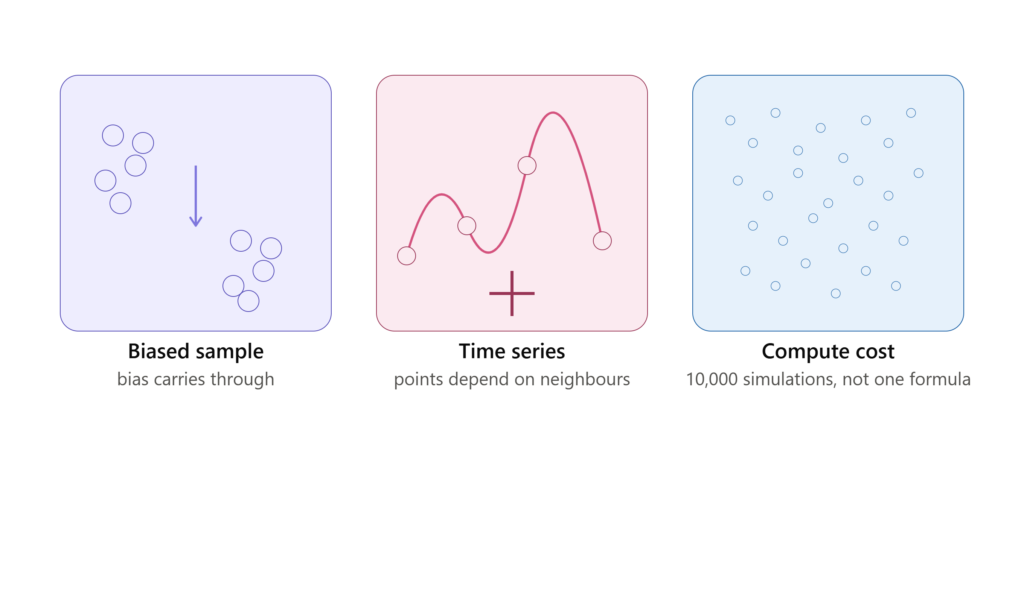
- It can’t fix bad data: If your original sample is biased, the bootstrap will simply replicate that bias. It assumes your sample is a good representation of the population.
- Dependence: Standard bootstrapping assumes data points are independent. For time-series data (where today’s value depends on yesterday’s), you need more advanced techniques like the “Block Bootstrap.”
- Computational Cost: It requires computing power. Running 10,000 simulations takes more time than plugging numbers into a formula.
Conclusion
The bootstrapping method represents a fundamental shift in how we approach statistics. It moves us away from strict, formula-based assumptions and toward computational power.
Whether you are a data scientist validating a model, a financial analyst assessing risk, or a researcher analyzing a small dataset, the bootstrap is an essential tool in your toolkit. It allows the data to speak for itself, giving you robust insights even when the textbook rules don’t apply.