
Designing Experiments That Actually Work: A Practical Guide
You have a brilliant idea. Maybe it’s a new feature for your app, a fresh marketing campaign, or a change to your company’s onboarding process. You’re confident it will work.
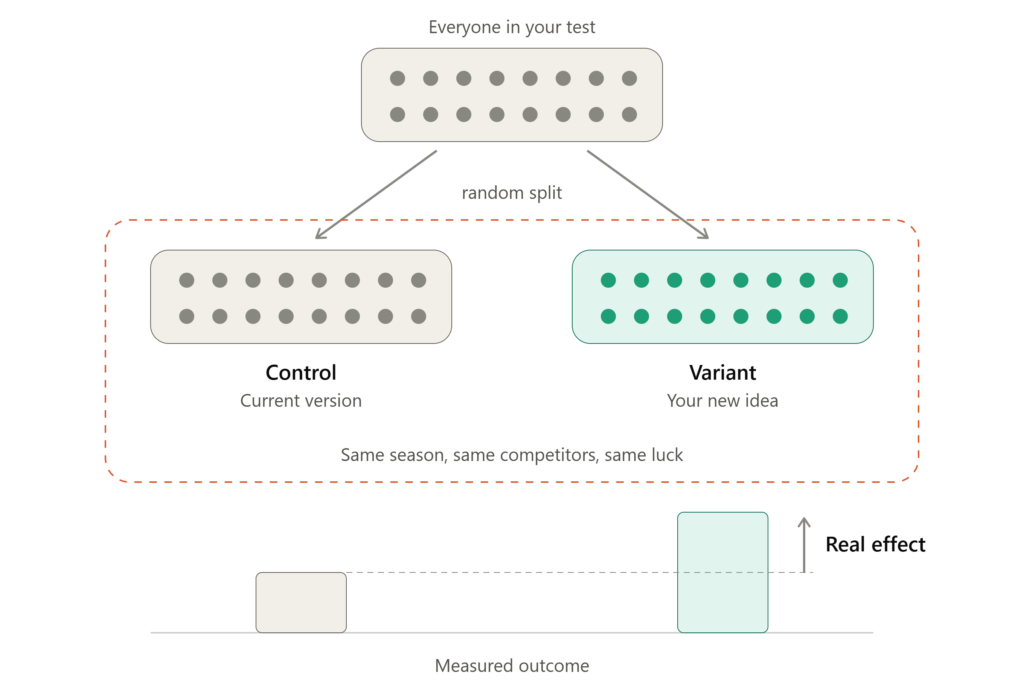
So you roll it out, track the results, and… the numbers go up. Success, right?
Not so fast.
How do you know the improvement was caused by your change and not by the season, a competitor going down, or just random luck? This is where the difference between “doing something” and “running an experiment” lies.
Designing an experiment that actually works—one that gives you trustworthy, actionable answers—is harder than it looks. But it’s not rocket science. This practical guide will walk you through the essential steps to design experiments that produce reliable results you can bet your decisions on.
Step 1: Start With a Crystal-Clear Question
Before you touch any data, you need to know exactly what you’re trying to find out. A vague question leads to a vague experiment, which leads to vague (and useless) results.
Bad question: “Does our new landing page work better?”
Good question: “Does changing the call-to-action button from blue to green increase the click-through rate on our landing page for first-time visitors?”
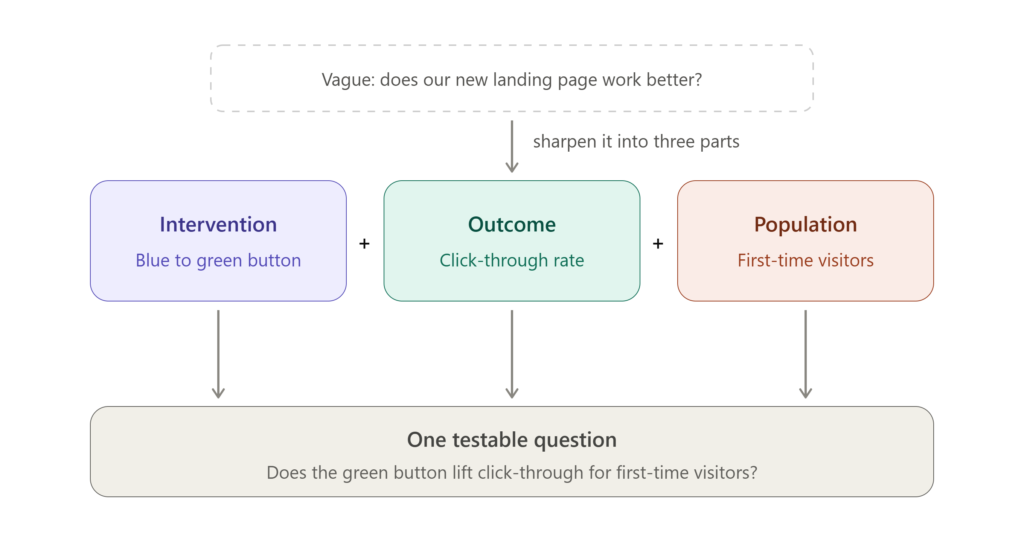
A strong research question has three components:
- A specific intervention: What exactly are you changing?
- A specific outcome: What exactly are you measuring?
- A specific population: Who are you measuring it on?
If you can’t articulate all three, you’re not ready to experiment yet.
Step 2: Define Your Hypothesis (and Be Willing to Be Wrong)
A hypothesis is a testable prediction. It forces you to commit to an expected outcome before you see the data—which protects you from the temptation to “find” a result after the fact.
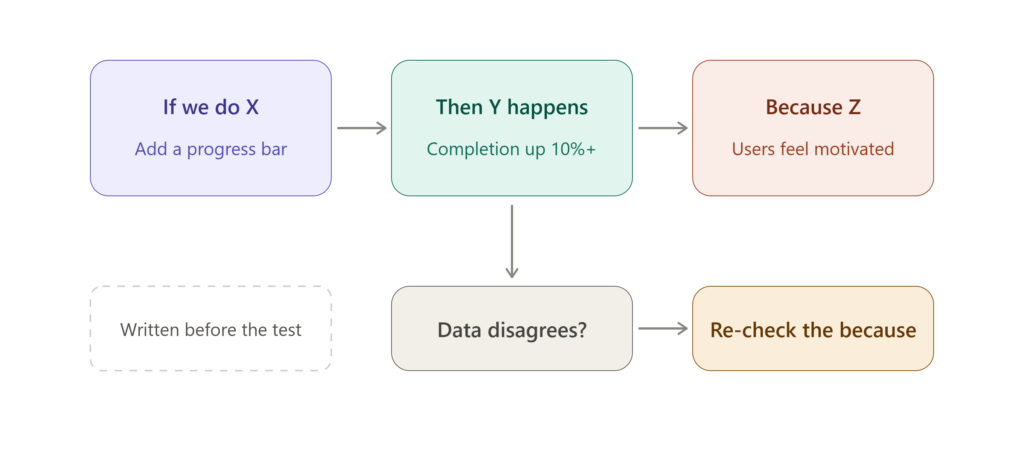
Format: “If we [do X], then [Y will happen], because [Z].”
Example: “If we add a progress bar to the signup flow, then completion rates will increase by at least 10%, because users will feel motivated to finish what they’ve started.”
The “because” part is crucial. It forces you to explain why you think your intervention will work. If the results contradict your hypothesis, the “because” gives you a clue about what went wrong in your reasoning.
Step 3: Randomize (This Is Non-Negotiable)
This is the single most important element of a well-designed experiment. Random assignment is what separates a true experiment from a mere observation.
By randomly assigning participants to either the treatment group (who get the intervention) or the control group (who don’t), you ensure that the two groups are statistically equivalent on every dimension—known and unknown.
- Known confounders: Age, income, device type, geography.
- Unknown confounders: Motivation, mood, prior experience—things you can’t even measure.
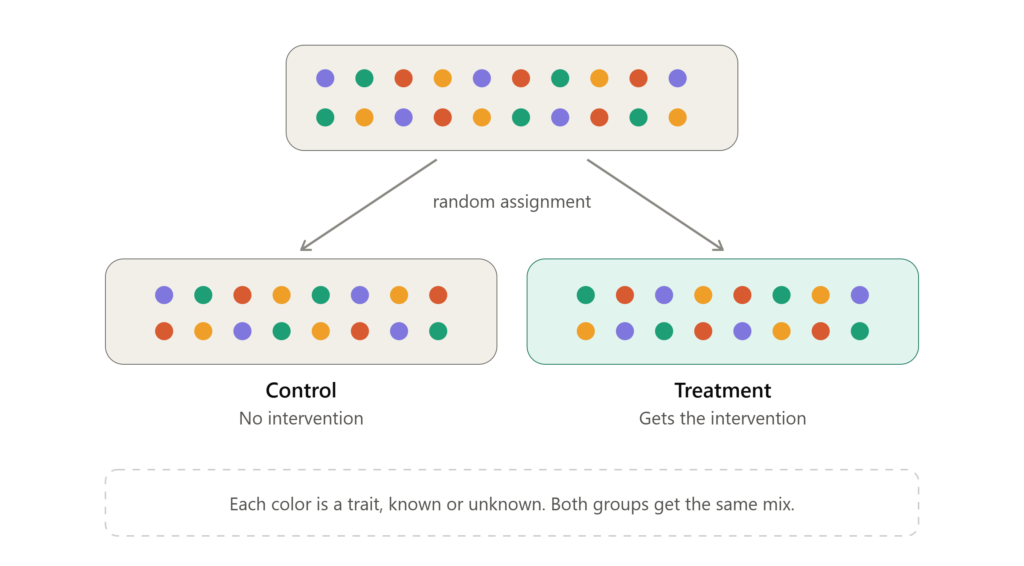
Randomization balances out all of these factors, on average. Without it, you can never be fully sure that your intervention caused the effect you observed.
Practical tip: Use a proper randomization tool (not “every other person” or “whoever signs up on Monday”). Simple random assignment via a random number generator or your experimentation platform is best.
Step 4: Control What You Can
While randomization handles unknown confounders, you still need to control the known ones to increase the precision of your results.
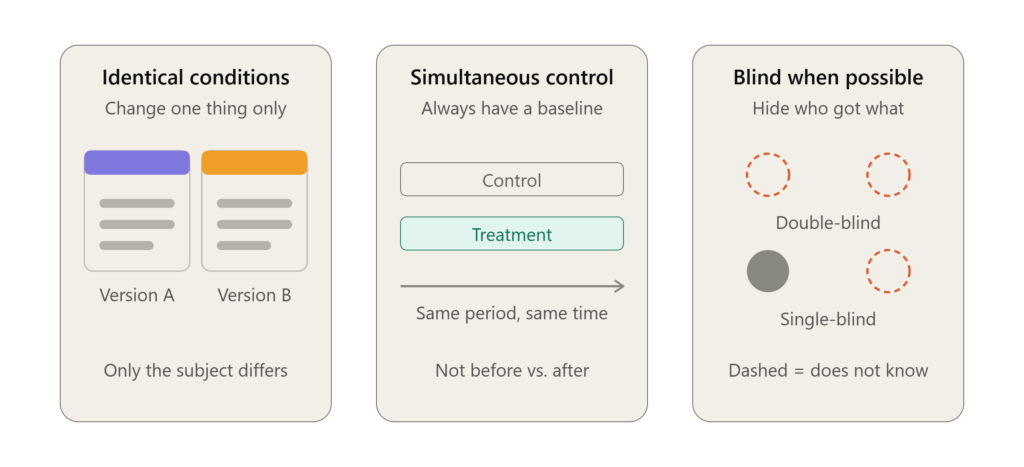
- Keep conditions identical: If you’re testing a new email subject line, send both versions at the same time of day, to similar segments, with the same body copy. The only difference should be the subject line.
- Use a control group: Always have a baseline to compare against. “Before vs. after” comparisons are weak because other things change over time. A simultaneous control group is the gold standard.
- Blind when possible: If participants (or the people measuring the outcome) know who’s in the treatment group, bias can creep in. Double-blind designs—where neither participants nor researchers know who got what—are ideal but not always feasible. Single-blind (where the measurer doesn’t know) is a good compromise.
Step 5: Choose the Right Sample Size (Before You Start)
One of the most common mistakes is running an experiment that’s too small to detect a real effect. If your sample size is too small, you might miss a genuine improvement because your data is too noisy.
Conversely, running an experiment that’s unnecessarily large wastes time and resources.
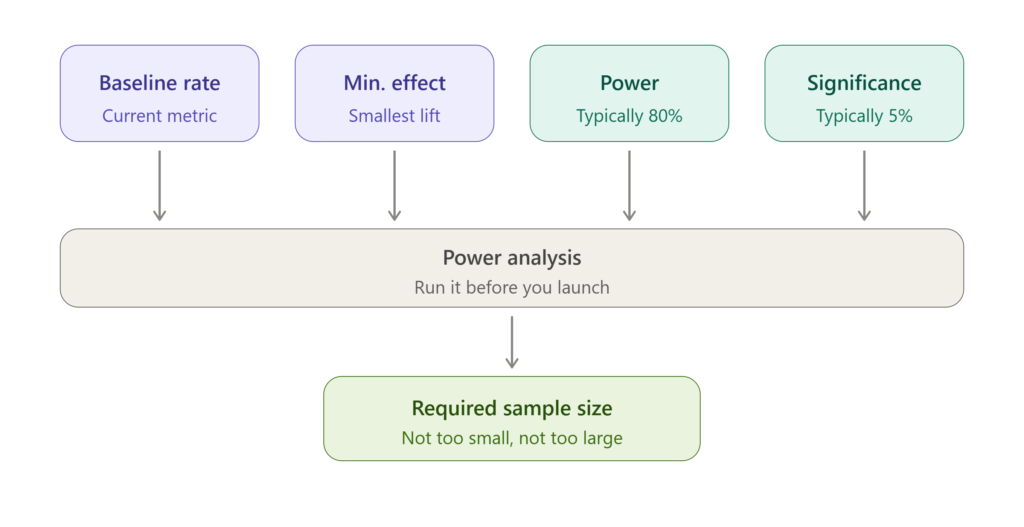
Use a power analysis to determine the sample size you need before launching. You’ll need to specify:
- Baseline rate: Your current conversion rate (or whatever metric you’re measuring).
- Minimum detectable effect (MDE): The smallest improvement you care about detecting. (A 1% lift might not be worth the engineering effort; a 10% lift probably is.)
- Statistical power: Typically 80%—the probability of detecting an effect if one truly exists.
- Significance level: Typically 5%—the risk you’re willing to take of a false positive.
Free online calculators (like Evan Miller’s or Optimizely’s) can do this math for you in seconds.
Step 6: Pick the Right Metric (and Only One Primary Metric)
You can track many metrics, but you should have one primary metric that determines whether the experiment succeeded or failed. This prevents “p-hacking”—the practice of testing many outcomes and cherry-picking the one that looks best.
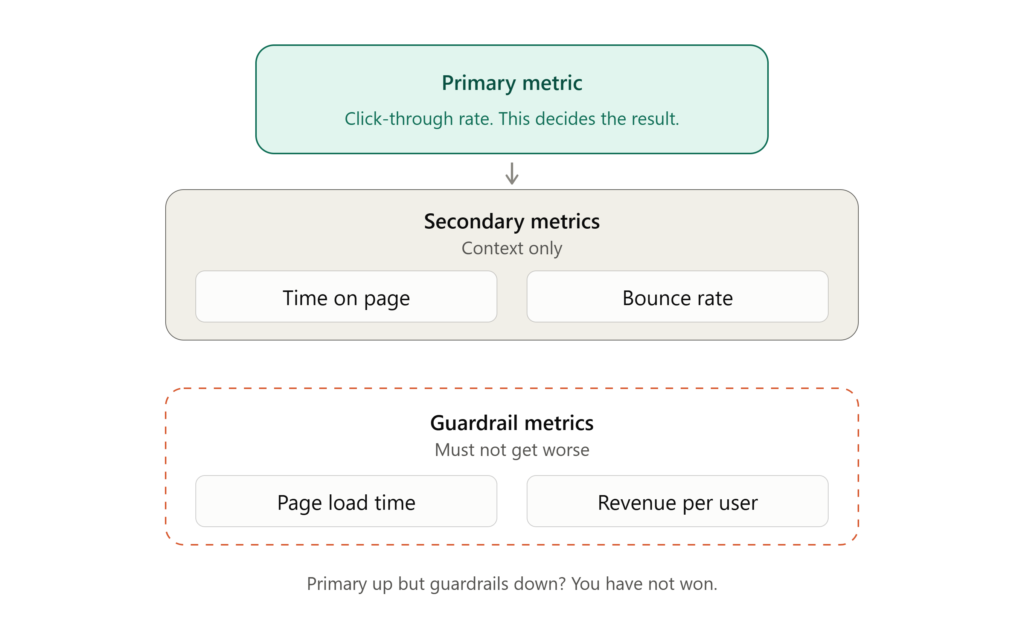
- Primary metric: The one thing your hypothesis is about. (e.g., click-through rate)
- Secondary metrics: Supporting metrics that provide context. (e.g., time on page, bounce rate)
- Guardrail metrics: Things that should not get worse. (e.g., page load time, revenue per user)
Red flag: If your primary metric improves but your guardrail metrics tank, you haven’t won—you’ve just shifted the problem.
Step 7: Run the Experiment Long Enough (But Not Too Long)
How long should you run your test? The answer is: until you reach your pre-determined sample size, and at least one full business cycle.
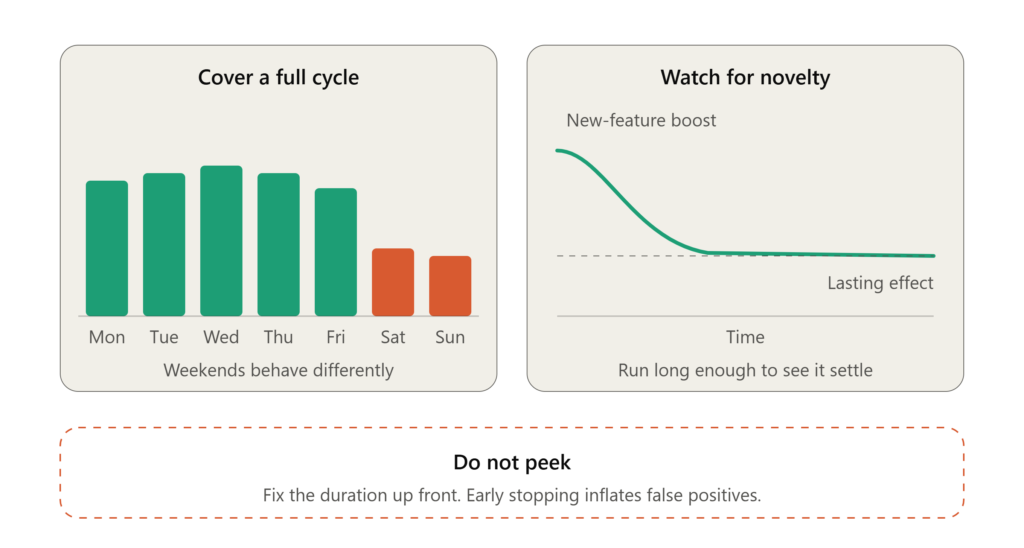
- Don’t peek: Checking results daily and stopping when you see a “significant” result inflates your false positive rate. Decide on a duration upfront and stick to it.
- Account for cycles: If your business has weekly patterns (e.g., lower engagement on weekends), run the experiment for at least a full week to capture that variation.
- Watch for novelty effects: Sometimes a new feature gets a temporary boost simply because it’s new. Running longer helps you see if the effect persists.
Step 8: Analyze Honestly (and Report Everything)
When the experiment ends, analyze the data according to the plan you made before you started. This is called pre-registration, and it’s your best defense against bias.
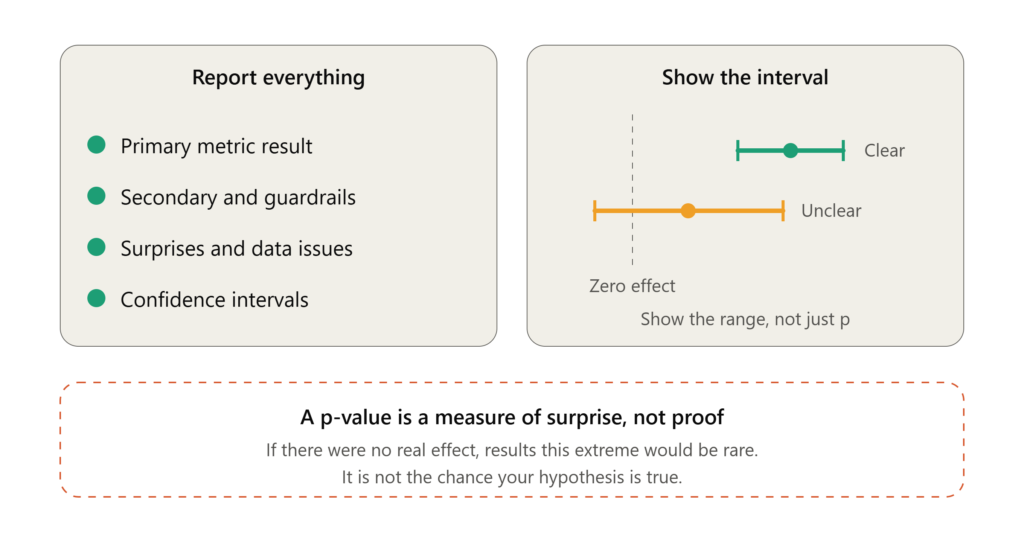
Report:
- The results for your primary metric.
- The results for secondary and guardrail metrics.
- Any unexpected findings or data quality issues.
- The confidence intervals (not just the p-value).
A note on p-values: A p-value of 0.05 doesn’t mean there’s a 95% chance your hypothesis is true. It means that if there were no real effect, you’d see results this extreme only 5% of the time. It’s a measure of surprise, not proof.
Step 9: Learn, Decide, and Iterate
An experiment isn’t a finish line—it’s a feedback loop. Whether your hypothesis was confirmed or refuted, you’ve learned something valuable.
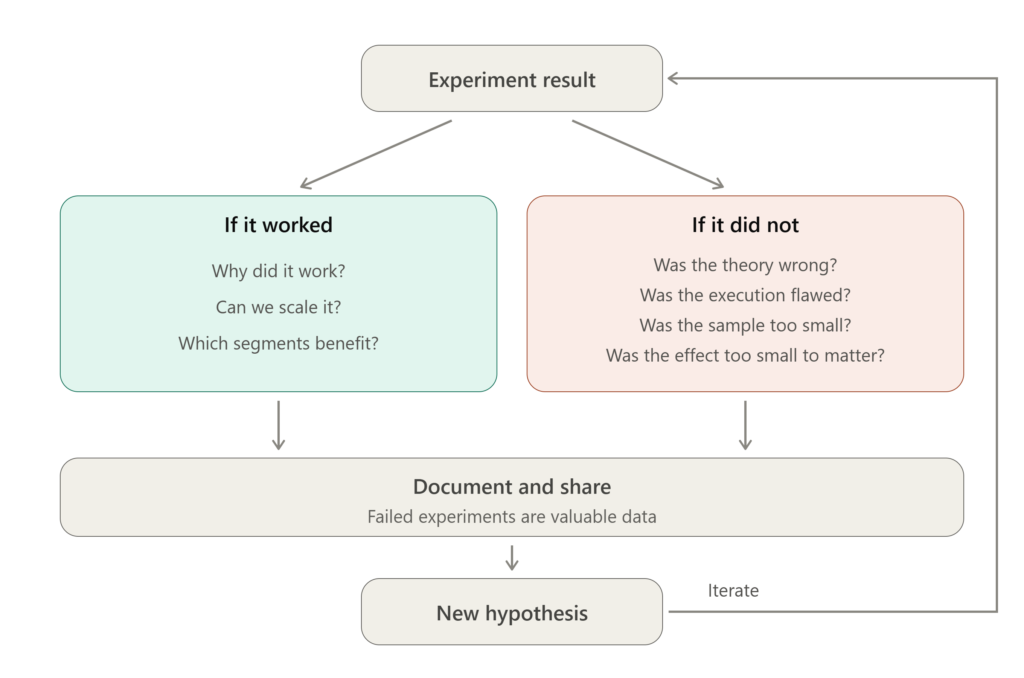
Ask:
- If it worked: Why? Can we scale it? Does it work for all segments or just some?
- If it didn’t work: Was our theory wrong, or was our execution flawed? Was the sample size too small? Was the effect real but smaller than we cared about?
Document your findings. Share them with your team. The best experimenters build a culture of learning, where failed experiments are treated as valuable data points, not failures.
Common Pitfalls to Avoid
| Pitfall | Why It’s a Problem | How to Fix It |
|---|---|---|
| No control group | Can’t isolate cause and effect | Always include a simultaneous control |
| Peeking at results | Inflates false positives | Pre-commit to a duration and sample size |
| Too many metrics | Encourages cherry-picking | Choose one primary metric upfront |
| Ignoring guardrails | You might “win” while breaking something else | Track and monitor guardrail metrics |
| Stopping early on a good result | The effect might be noise | Wait for your pre-determined sample size |
| Not randomizing properly | Confounders bias your results | Use a true random assignment tool |
The Bottom Line
A well-designed experiment is an act of discipline. It requires you to commit to a question, a hypothesis, a sample size, and a metric before you see a single data point. It demands that you resist the urge to peek, to cherry-pick, or to explain away inconvenient results.
But the payoff is enormous: decisions you can trust. In a world full of noise and hunches, the ability to run a clean experiment is a superpower.
So the next time you have a “brilliant idea,” don’t just roll it out and hope for the best. Design an experiment that actually works—and let the data tell you the truth.
What’s the biggest experiment design mistake you’ve seen (or made)? Share your stories in the comments below!