
How Stores Use Data to Increase Sales
Walk into a modern retail store and you might think you’re simply looking at shelves full of products, attractive discounts, and promotional displays.
Behind the scenes, however, there is often a huge amount of data influencing what you see.
Retailers collect information about what customers buy, when they shop, which products they view, what promotions they respond to, and how much they spend. By analyzing this information, stores can make smarter decisions about pricing, inventory, marketing, product placement, and customer experience.
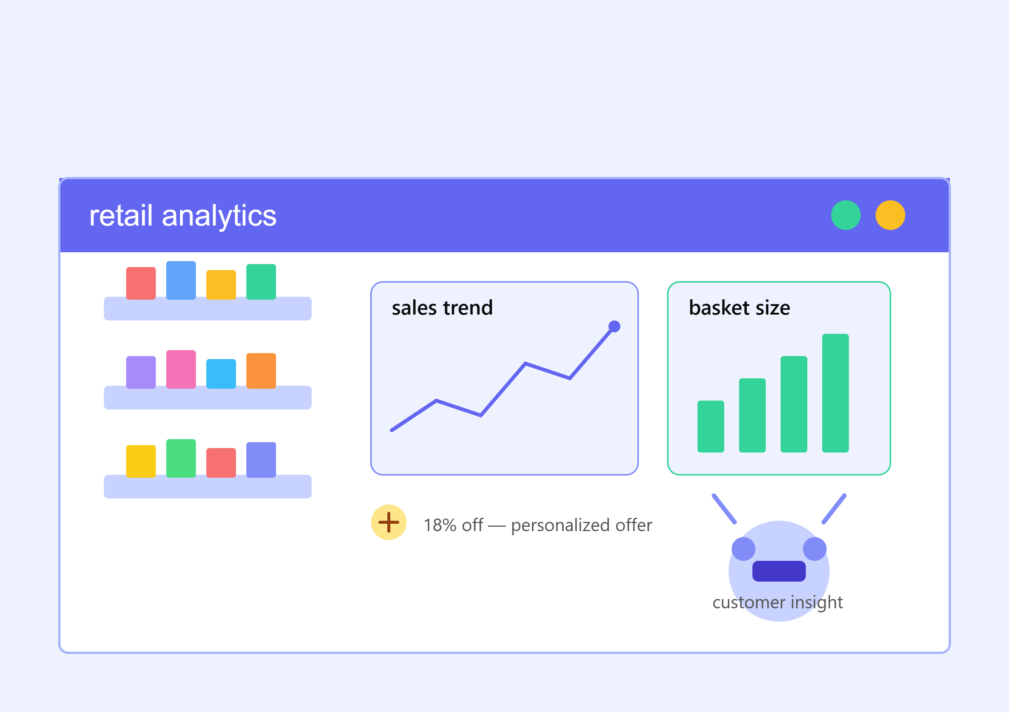
This is where retail analytics comes in.
Retail analytics helps businesses turn large amounts of customer and sales data into actionable insights. Instead of relying entirely on intuition, retailers can use data to understand customer behavior and identify opportunities to increase revenue.
What Is Retail Analytics?
Retail analytics is the process of collecting, analyzing, and interpreting data related to retail operations and customer behavior.
Retailers may analyze data from:
- Point-of-sale (POS) systems
- E-commerce websites
- Mobile applications
- Customer loyalty programs
- Social media
- Online advertising
- Inventory systems
- Customer reviews
- Store traffic and footfall
- Product returns
The goal is to answer important business questions such as:
What products are selling?
Who is buying them?
When are customers buying?
Which promotions work?
Which products are frequently purchased together?
Which customers are likely to make another purchase?
The answers can help retailers improve their sales and operational decisions.
Why Is Retail Analytics Important?
Retail is highly competitive. Customers have more choices than ever, and businesses need to understand what their customers actually want.
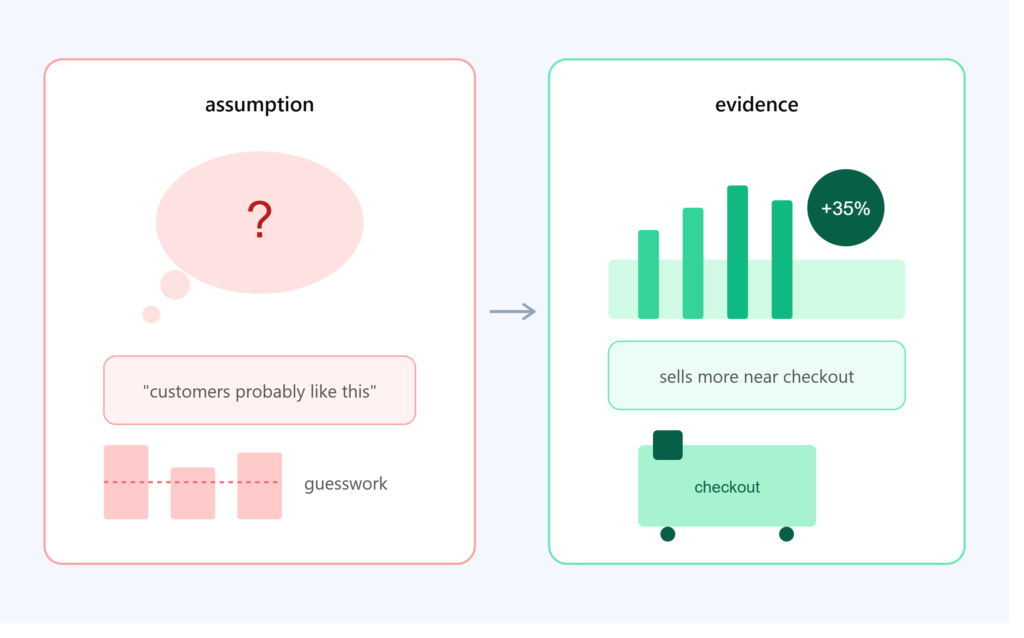
Traditional retail decisions might be based on experience or assumptions.
For example:
“Customers probably prefer this product.”
Retail analytics allows a business to replace assumptions with measurable evidence:
“Sales data shows that this product sells 35% more when displayed near the checkout.”
This shift from intuition to evidence can help retailers make more informed decisions.
1. Understanding Customer Buying Behavior
One of the most valuable applications of retail analytics is understanding how customers behave.
Retailers can analyze:
- Purchase frequency
- Average order value
- Preferred products
- Shopping times
- Product categories
- Discounts used
- Repeat purchases
- Online browsing behavior
For example, suppose a clothing store discovers that customers who purchase formal shirts frequently purchase trousers within the following two weeks.
The retailer could use this insight to create targeted recommendations or promotions.
Example
A customer purchases:
Formal Shirt → Trousers → Belt
The retailer can use this purchasing pattern to recommend belts immediately after a customer purchases a formal shirt.
This can increase the value of each transaction.
2. Product Recommendations
Have you ever visited an online store and seen suggestions such as:
“You may also like…”
or
“Customers who bought this also bought…”
These recommendations are powered by data analysis.
Retailers analyze previous customer behavior to identify relationships between products.
For example:
A customer purchases a laptop.
The retailer might recommend:
- Laptop bag
- Wireless mouse
- Keyboard
- Headphones
- External storage
Instead of showing random products, the system uses purchasing patterns to identify potentially relevant products.
This can support cross-selling and upselling.
3. Market Basket Analysis
One popular retail analytics technique is market basket analysis.
It examines which products customers tend to purchase together.
Imagine a supermarket analyzes thousands of transactions and discovers:
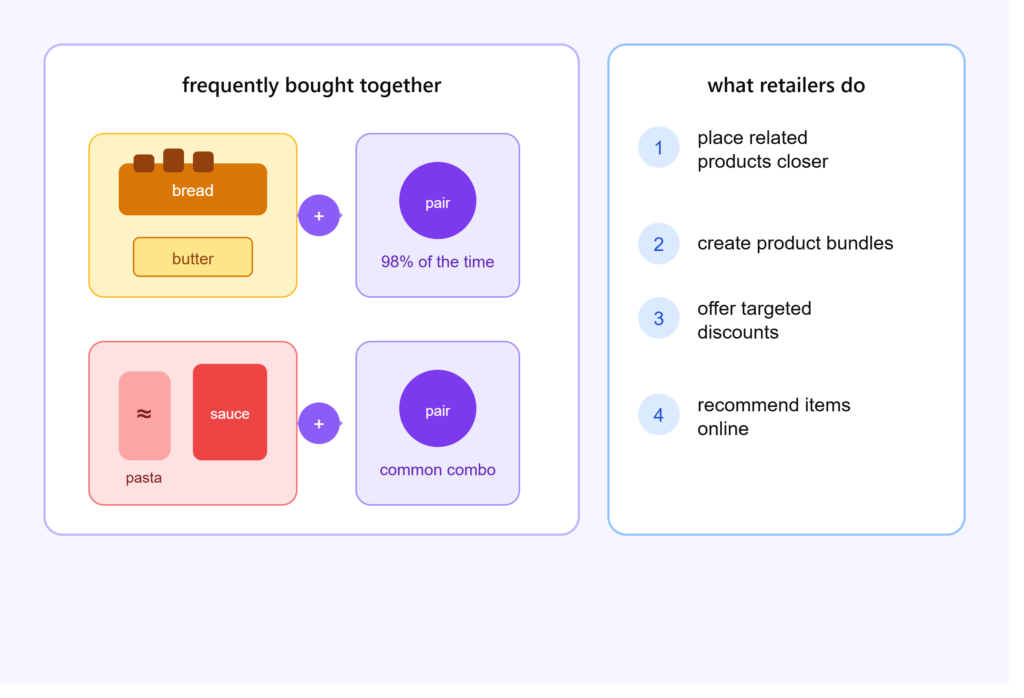
Bread + Butter → frequently purchased together
or:
Pasta + Pasta Sauce → frequently purchased together
The retailer can use these findings to:
- Place related products closer together.
- Create product bundles.
- Offer targeted discounts.
- Recommend complementary products online.
Simple Example
Suppose 10,000 transactions are analyzed.
Researchers find that 2,500 customers purchased both Product A and Product B.
The retailer can investigate whether the relationship is strong enough to support a bundle or promotional campaign.
This type of analysis can help increase the number of products purchased per transaction.
4. Personalized Marketing
Not every customer responds to the same advertisement.
A teenager shopping for sportswear may have very different preferences from a customer shopping for home appliances.
Retail analytics allows businesses to divide customers into meaningful groups.
For example:
Segment A: Frequent Customers
- Shop regularly
- Higher purchase frequency
- Strong loyalty
Segment B: Discount-Sensitive Customers
- Purchase primarily during sales
- Frequently use coupons
- Respond strongly to promotions
Segment C: Inactive Customers
- Previously purchased
- Have not purchased recently
The retailer can create different marketing strategies for each group.
Instead of sending the same promotion to everyone, businesses can send more relevant offers based on customer behavior.
5. Customer Segmentation
Customer segmentation is closely related to personalized marketing.
Retailers can segment customers according to variables such as:
- Age group
- Location
- Purchase frequency
- Spending level
- Product preferences
- Recency of purchase
- Customer lifetime value
One widely used framework is RFM analysis.
RFM stands for:
Recency – How recently did the customer purchase?
Frequency – How often does the customer purchase?
Monetary Value – How much does the customer spend?
For example, a retailer could identify customers who purchased recently, purchase frequently, and spend significant amounts.
These customers may be particularly important for retention strategies.
6. Dynamic Pricing
Prices can have a major impact on sales.
Retail analytics allows businesses to analyze factors such as:
- Demand
- Competition
- Seasonality
- Inventory levels
- Customer behavior
- Historical sales
Based on these factors, retailers can evaluate pricing strategies.
For example, if demand for a particular product is falling while inventory is high, a retailer might consider a promotional price.
Similarly, if demand is exceptionally strong, the retailer may review its pricing strategy.
Dynamic pricing is particularly common in digital commerce and other markets where prices can be adjusted quickly.
7. Inventory Management
Having the right product available at the right time is critical.
If a store runs out of a popular product, it can lose potential sales.
On the other hand, ordering too much inventory can lead to:
- Storage costs
- Excess stock
- Product markdowns
- Waste
- Cash-flow problems
Retail analytics helps businesses forecast demand.
For example, historical data might show that sales of winter jackets increase significantly during a particular period.
The retailer can use this information when planning inventory.
Simple Forecasting Process
Historical Sales Data
↓
Seasonality Analysis
↓
Demand Forecast
↓
Inventory Planning
↓
Replenishment
This allows retailers to move toward data-driven inventory decisions.
8. Sales Forecasting
Sales forecasting is another major application of retail analytics.
Retailers can use historical data to estimate future sales.
Factors may include:
- Previous sales
- Seasonal trends
- Holidays
- Promotions
- Prices
- Customer demand
- Economic conditions
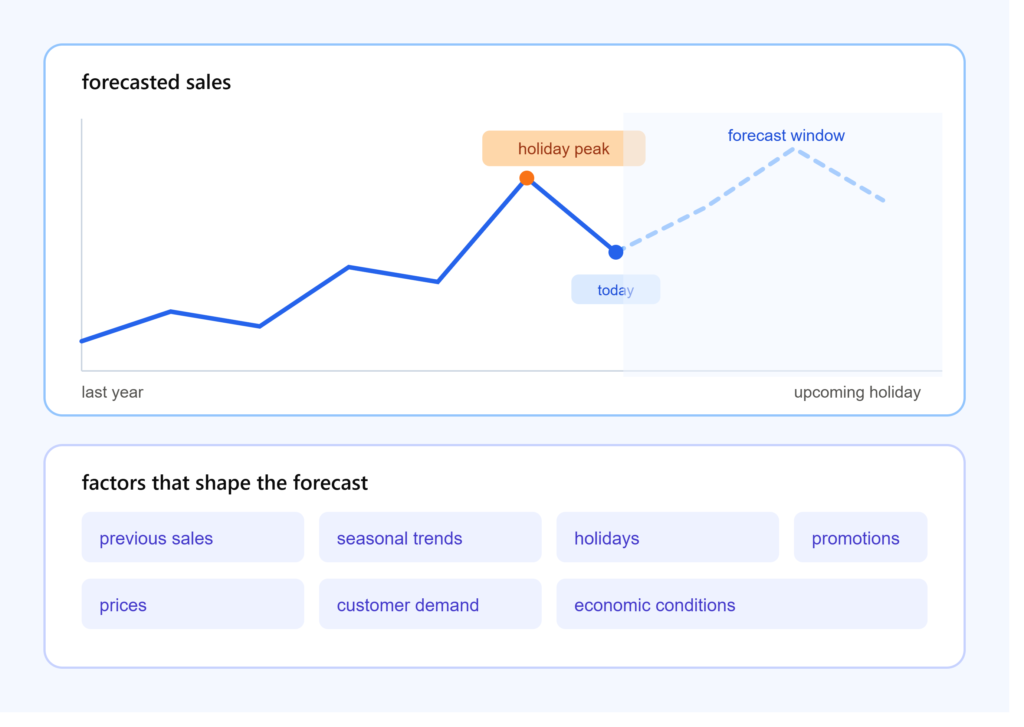
For example, a supermarket might analyze previous years’ sales to estimate demand during a major holiday period.
If historical data shows that demand typically rises before the holiday, the retailer can prepare inventory and staffing accordingly.
Forecasting does not guarantee future sales, but it can provide a structured basis for planning.
9. Store Layout and Product Placement
Data can also influence where products are placed inside a physical store.
Retailers may study:
- Customer movement
- Product sales
- Foot traffic
- Checkout behavior
- Product combinations
Suppose data shows that customers frequently purchase snacks and soft drinks together.
The retailer might experiment with placing those products closer together.
Similarly, high-demand products may be positioned in areas designed to increase visibility.
The objective is to make the shopping experience easier while also encouraging relevant purchases.
10. Promotion and Discount Analysis
Retailers frequently use discounts to attract customers.
But not every promotion produces the same result.
Suppose a store runs two campaigns:
Campaign A: 10% discount
Campaign B: Buy two, get one free
Sales increase during both campaigns, but the retailer needs to know whether the additional sales generated enough profit to justify each promotion.
Analytics can help evaluate:
- Sales before the promotion
- Sales during the promotion
- Sales after the promotion
- Customer response
- Average order value
- Profit margins
- Repeat purchases
This helps businesses understand the difference between increasing sales volume and increasing profitable sales.
11. Customer Lifetime Value
A customer who makes one large purchase is not necessarily more valuable than a customer who makes smaller purchases regularly.
Retailers can use Customer Lifetime Value (CLV) to estimate the long-term value of customer relationships.
For example:
Customer A:
- Purchases $500 once.
Customer B:
- Purchases $80 every month for three years.
Although Customer A made the larger single transaction, Customer B may generate considerably more revenue over time.
CLV analysis can help businesses decide how much effort and resources to devote to customer retention.
12. Predicting Customer Churn
Retailers also want to know when customers may stop purchasing.
Analytics can identify patterns associated with declining customer activity.
For example, a customer who previously purchased every month may suddenly stop purchasing for several months.
A retailer could use this information to trigger a retention campaign, such as:
- Personalized recommendations
- Loyalty rewards
- Relevant promotions
- Product reminders
- Customer service outreach
The goal is to understand changing customer behavior before the relationship is lost.
13. Using Data to Improve E-Commerce Sales
Online retailers have access to particularly detailed behavioral data.
They can analyze:
- Website visits
- Search queries
- Product views
- Add-to-cart events
- Abandoned carts
- Checkout completion
- Traffic sources
- Device types
Suppose 10,000 visitors view a product.
If 1,000 add it to their cart but only 500 complete the purchase, the retailer has an opportunity to investigate the remaining 500 abandoned carts.
Possible causes could include:
- Unexpected shipping costs
- Complicated checkout
- Limited payment options
- Slow website performance
- Lack of product information
Analytics can help identify where customers leave the purchasing process.
14. A/B Testing
Retailers can also use experiments to determine which version of a website or promotion performs better.
For example:
Version A: “Buy Now”
Version B: “Add to Cart”
Customers can be randomly exposed to different versions, and the retailer can compare outcomes such as conversion rate.
A/B testing can be used for:
- Product pages
- Headlines
- Promotions
- Email campaigns
- Website layouts
- Checkout processes
The important principle is to test changes systematically rather than assuming that one design will perform better.
15. Using Machine Learning in Retail Analytics
Modern retailers increasingly use machine learning to analyze large datasets.
Machine-learning models can be used for tasks such as:
- Demand forecasting
- Product recommendations
- Customer segmentation
- Churn prediction
- Fraud detection
- Price optimization
- Inventory planning
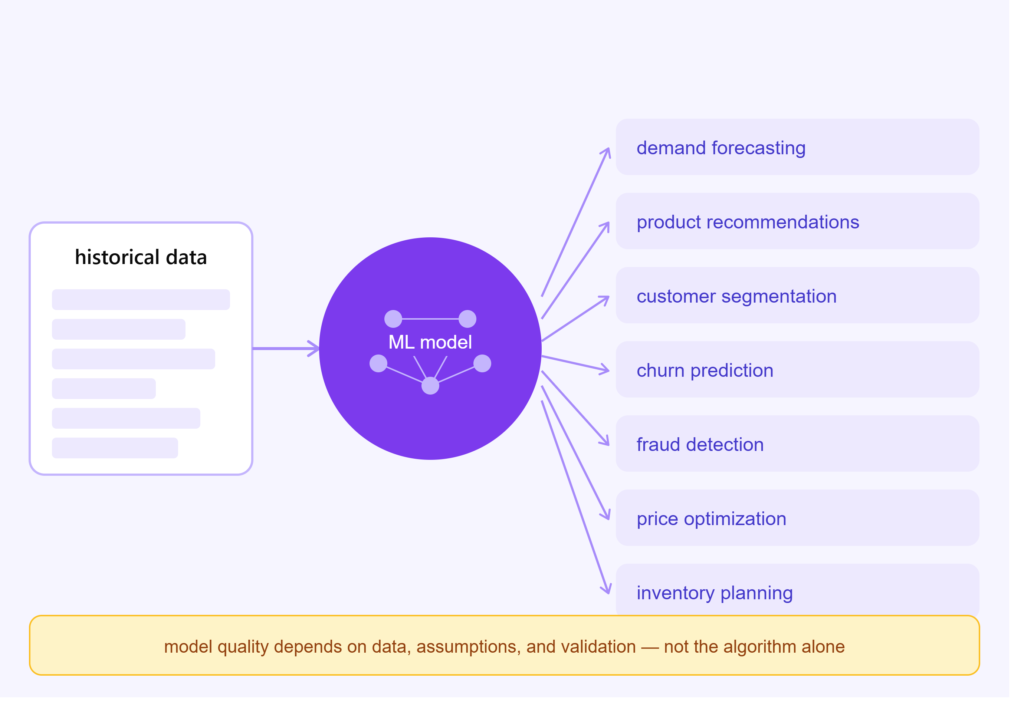
For example, a retailer could train a model using historical sales data to estimate future product demand.
However, machine learning is not automatically better than traditional statistical methods. Model quality depends on the data, assumptions, validation process, and business problem.
A Simple Retail Analytics Example
Imagine a supermarket has five years of transaction data.
The dataset contains:
- Product ID
- Product category
- Date
- Quantity sold
- Price
- Discount
- Customer ID
- Store location
The retailer could perform several analyses.
Step 1: Analyze Sales Trends
Identify which products and categories generate the most sales.
Step 2: Analyze Seasonality
Determine whether sales increase during particular months, holidays, or seasons.
Step 3: Analyze Customer Behavior
Identify frequent customers and their purchasing patterns.
Step 4: Perform Market Basket Analysis
Find products that are frequently purchased together.
Step 5: Forecast Demand
Estimate future sales for important products.
Step 6: Optimize Inventory
Use forecasts to support replenishment decisions.
Step 7: Evaluate Promotions
Compare sales and profitability before, during, and after campaigns.
The result is a connected analytics process rather than a single report.
Key Retail Analytics Metrics
Retailers often monitor several important metrics.
| Metric | What It Measures |
|---|---|
| Total Sales | Overall revenue generated |
| Average Order Value | Average amount spent per transaction |
| Conversion Rate | Percentage of visitors who make a purchase |
| Customer Retention Rate | Percentage of customers who continue purchasing |
| Customer Lifetime Value | Estimated long-term customer value |
| Inventory Turnover | How quickly inventory is sold |
| Gross Margin | Revenue remaining after cost of goods |
| Basket Size | Number/value of items purchased per transaction |
| Cart Abandonment Rate | Percentage of online carts not converted into purchases |
Tracking these metrics helps retailers understand both sales performance and customer behavior.
Challenges in Retail Analytics
Although retail analytics offers significant opportunities, it also presents challenges.
Data Quality
Incorrect, duplicate, or incomplete records can produce misleading results.
Data Integration
Retailers may have separate systems for stores, websites, mobile apps, inventory, and loyalty programs.
Combining these datasets can be technically difficult.
Privacy
Customer data must be handled responsibly and according to applicable privacy requirements.
Changing Customer Behavior
Historical patterns do not always continue into the future.
Customer preferences can change because of trends, competitors, economic conditions, or unexpected events.
Overreliance on Data
Data provides evidence, but it does not eliminate the need for business judgment. Analysts should consider the context behind the numbers.
How Retailers Can Build a Data-Driven Strategy
A successful retail analytics strategy does not necessarily begin with sophisticated artificial intelligence.
It can begin with a few practical steps:
1. Define the Business Problem
Instead of asking:
“What can we do with our data?”
ask:
“Why are sales declining in this category?”
or:
“Which products are commonly purchased together?”
2. Collect Reliable Data
Make sure sales, customer, inventory, and product information are accurate and consistent.
3. Visualize the Data
Dashboards and charts can make trends easier to identify.
4. Analyze Customer Behavior
Look for purchasing patterns, customer segments, and changes over time.
5. Test Business Decisions
Use controlled experiments where appropriate.
6. Measure Results
After implementing a strategy, measure whether the expected business outcome actually occurred.
The Future of Retail Analytics
Retail analytics is moving toward increasingly real-time and predictive decision-making.
Retailers can combine:
Customer Data + Sales Data + Inventory Data + Online Behavior + Predictive Analytics
to develop a more complete understanding of their business.
Artificial intelligence and machine learning may further automate tasks such as demand forecasting, product recommendations, and customer-service personalization.
However, the foundation remains the same:
Better data → Better analysis → Better-informed business decisions.
Technology can process enormous amounts of information, but retailers still need clear business objectives and responsible data practices.
Final Thoughts
Retail analytics has changed the way stores understand customers and manage their businesses.
From personalized recommendations and market basket analysis to sales forecasting, inventory management, customer segmentation, and promotion analysis, data can support decisions across almost every part of the retail process.
The real value of retail analytics is not simply collecting more data. It is turning data into useful insights that help retailers understand demand, improve customer experiences, manage inventory, and evaluate sales strategies.
In a competitive retail environment, businesses that develop strong analytical processes can make decisions based on evidence rather than assumptions.
And as retail continues to become more digital, the ability to understand and use data effectively will remain an important part of modern retail management.