
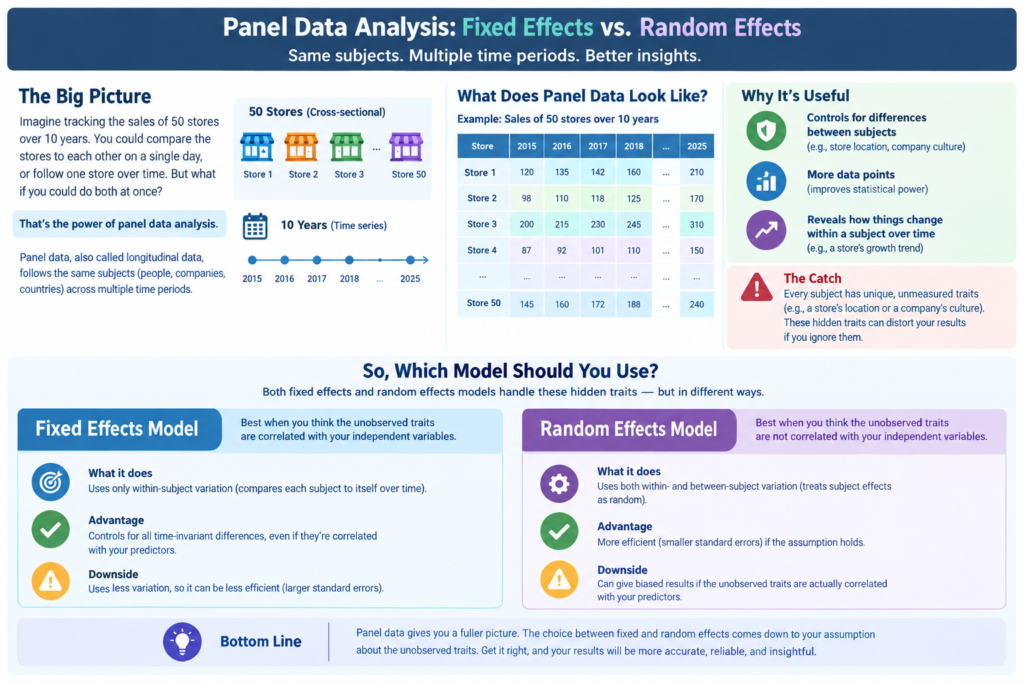
Imagine tracking the sales of 50 stores over 10 years. You could compare the stores to each other on a single day, or follow one store over time. But what if you could do both at once?
That’s the power of panel data analysis. Panel data, also called longitudinal data, follows the same subjects (people, companies, countries) across multiple time periods. It’s richer than a one-time snapshot, but it raises a big question: should you use a fixed effects model or a random effects model?
Get it wrong, and your results can be misleading. This guide breaks down both approaches in plain English.
What Is Panel Data?
Panel data combines two dimensions:
- Cross-sectional: many subjects (e.g., 200 households)
- Time series: repeated observations (e.g., yearly income from 2015 to 2025)
Why it’s useful:
- Controls for differences between subjects that you can’t directly measure
- Gives more data points, which improves statistical power
- Reveals how things change within a subject over time
The catch is that every subject has its own unique traits, like a store’s location or a company’s culture. These hidden traits can distort your results if you ignore them, and that’s exactly what fixed and random effects models are designed to handle.
Fixed Effects Model: “Every Subject Is Unique”
How It Works
A fixed effects (FE) model assumes each subject has its own baseline that may be correlated with your explanatory variables. It removes those stable, subject-specific traits from the analysis, so you only look at changes within each subject over time.
Think of it as comparing each store only to itself: “When Store A increased advertising, what happened to Store A’s sales?”
Key Points
- Controls for all time-invariant characteristics, even ones you never measured
- Protects against omitted variable bias from stable traits
- Uses only within-subject variation
Pros and Cons
Pros:
- Robust when unobserved traits are related to your predictors
- Fewer assumptions to defend
Cons:
- Cannot estimate the effect of time-invariant variables (like gender, industry, or region), since they’re wiped out
- Less efficient if there is little change within subjects over time
Random Effects Model: “Differences Are Random”
How It Works
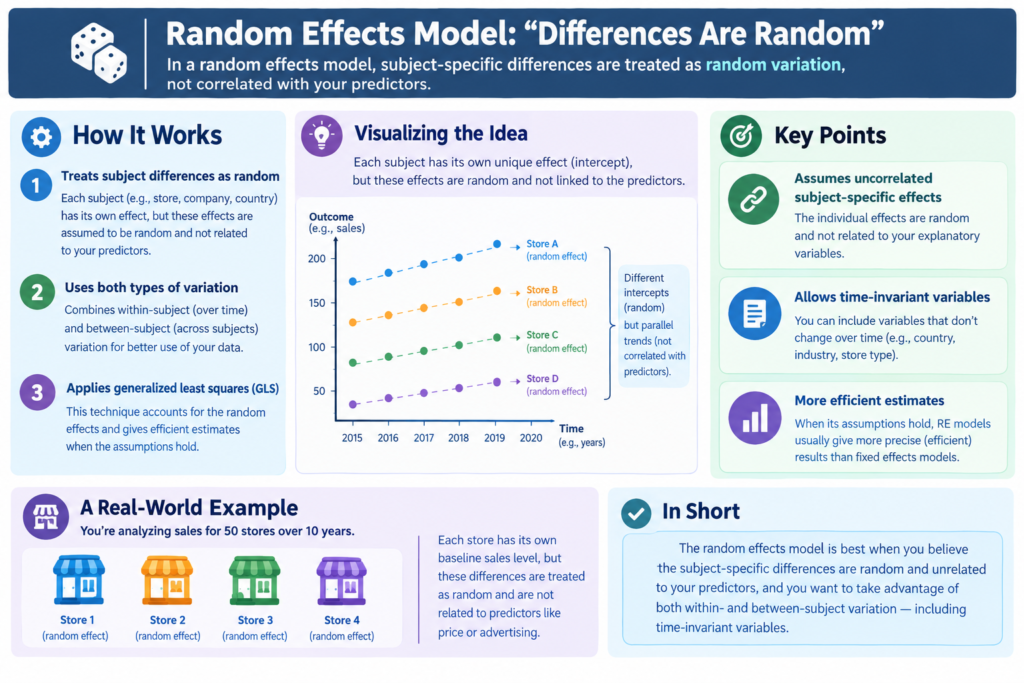
A random effects (RE) model treats differences between subjects as random variation that is not correlated with your predictors. It uses both within-subject and between-subject variation, making better use of your data.
Key Points
- Assumes subject-specific effects are uncorrelated with explanatory variables
- Allows you to include time-invariant variables (e.g., country, industry)
- Generally gives more efficient estimates when its assumptions hold
Pros and Cons
Pros:
- More statistical efficiency
- Works well when subjects are a random sample from a larger population
Cons:
- Produces biased results if the “no correlation” assumption is violated
- That assumption is often hard to justify in real-world data
Fixed Effects vs Random Effects: Quick Comparison
| Feature | Fixed Effects | Random Effects |
|---|---|---|
| Unobserved traits | Correlated with predictors | Uncorrelated with predictors |
| Time-invariant variables | Not estimable | Estimable |
| Variation used | Within subjects | Within and between |
| Efficiency | Lower | Higher (if valid) |
| Risk | Loses some data | Bias if assumption fails |
How to Choose: The Hausman Test
You don’t have to guess. The Hausman test is the standard tool for choosing between the two models.
How to read it:
- Significant result (p < 0.05): the models differ meaningfully, so use fixed effects
- Non-significant result (p ≥ 0.05): random effects is acceptable, and it’s more efficient
Practical shortcuts:
- Studying specific entities (all 50 U.S. states)? Lean toward fixed effects.
- Sampling randomly from a large population (survey respondents)? Consider random effects.
- Need to estimate time-invariant variables? Random effects (or a hybrid model) may be necessary.
- Not sure? Fixed effects is the safer default, since it’s less likely to be biased.
Common Mistakes to Avoid
- Picking a model without testing the assumptions
- Ignoring serial correlation or heteroskedasticity (use robust standard errors)
- Forgetting that fixed effects can’t tell you about variables that never change within a subject
- Treating the Hausman test as the final word rather than one piece of evidence
Tools to Get Started
You can run both models in most statistical software:
- R: the
plmpackage - Python: the
linearmodelspackage - Stata:
xtreg, feandxtreg, re
Conclusion
The choice between fixed and random effects comes down to one question: are the unobserved differences between your subjects related to your predictors? If yes, or if you’re unsure, fixed effects is the safer path. If not, random effects gives you more efficient estimates and lets you study stable characteristics.
Panel data is one of the most powerful tools in applied analysis, and now you know how to use it without falling into the most common traps.
Ready to put this into practice? Download a sample panel dataset, run both models in R or Python, and compare the results with a Hausman test. Have questions or a tricky dataset? Drop a comment below, and subscribe for more beginner-friendly guides to data analysis.