
Are your employees working hard but productivity is still falling?
Do you know why some employees perform better than others? Or why good employees leave while weaker performers stay?
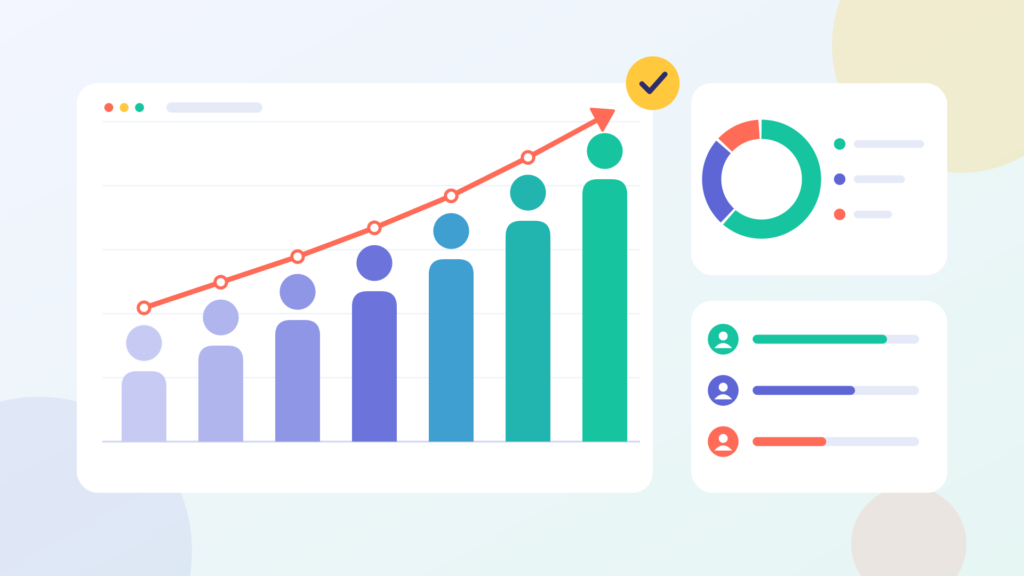
Many companies answer these questions using opinions, annual reviews, and guesswork. But modern HR teams have another option: HR analytics.
HR analytics uses employee data to find patterns, measure performance, identify problems, and support better decisions. Instead of asking, “What do we think is happening?”, HR teams can ask, “What does the data tell us?”
The result can be better employee development, stronger managers, smarter hiring, and improved business performance.
In this guide, we’ll explore what HR analytics is, how it improves employee performance, which metrics matter, real-world examples, common challenges, and how your organization can get started.
Table of Contents
- What Is HR Analytics?
- Why HR Analytics Matters for Employee Performance
- How HR Analytics Improves Employee Performance
- Key HR Analytics Metrics to Track
- Real Example of HR Analytics in Action
- How to Build an HR Analytics Strategy
- Common Challenges in HR Analytics
- Best Practices for Using Employee Data
- The Future of HR Analytics
- Frequently Asked Questions
- Conclusion
What Is HR Analytics?
HR analytics is the process of collecting, analyzing, and using employee-related data to make better HR and business decisions.
Companies can analyze data about:
- Employee performance
- Attendance
- Employee turnover
- Training
- Compensation
- Recruitment
- Employee engagement
- Absenteeism
- Productivity
- Promotions
- Skills and capabilities
For example, imagine a company notices that employee performance drops after the first six months.
Instead of assuming employees are becoming less motivated, HR can analyze training records, workload, manager feedback, absenteeism, engagement surveys, and performance scores.
The data may reveal that employees are not receiving enough development opportunities after onboarding.
That gives management a specific problem to solve.
Why HR Analytics Matters for Employee Performance
Traditional HR often focuses on processes such as hiring, payroll, leave management, and employee records.
HR analytics goes one step further.
It helps answer important questions such as:
- Which factors are linked with high performance?
- Which teams have the highest turnover?
- Does training improve performance?
- Are employees receiving useful feedback?
- Which skills are missing?
- Where are productivity problems occurring?
- Which employees may need additional support?
This changes HR from a mainly administrative function into a data-informed business function.
However, data should support human judgment rather than replace it. A performance score alone cannot explain everything happening in an employee’s work.
How HR Analytics Improves Employee Performance
1. Identifies Performance Gaps
One of the biggest benefits of employee performance analytics is finding gaps between expected and actual performance.
Suppose a sales team has a monthly target of $50,000 per employee.
HR and managers can compare:
- Sales results
- Experience
- Training completed
- Customer interactions
- Workload
- Attendance
- Manager feedback
The goal isn’t simply to identify low performers.
The goal is to understand what is preventing better performance.
A performance gap caused by a lack of training requires a different solution from one caused by excessive workload.
2. Helps Personalize Employee Development
Not every employee needs the same training.
One employee may need leadership training, while another needs technical skills. A third may already have strong skills but need opportunities to work on larger projects.
HR analytics can connect performance data with:
- Skills assessments
- Training history
- Career goals
- Performance reviews
- Job roles
- Promotion history
This allows companies to create more targeted development plans.
Better data → better development decisions → stronger employee capabilities.
3. Measures Whether Training Actually Works
Companies often spend significant resources on employee training.
But an important question is:
Did the training improve performance?
HR analytics can compare performance before and after training.
For example:
Before training: Average customer satisfaction score = 78
After training: Average customer satisfaction score = 86
This doesn’t automatically prove that training caused the improvement. Other factors may have changed.
But it gives HR a useful starting point for deeper analysis.
Organizations can also compare trained and untrained groups where appropriate, while accounting for differences between employees.
4. Improves Employee Engagement
Engaged employees often show stronger involvement in their work, but engagement is not something HR should assume from a single survey score.
Companies can combine engagement survey results with other information, such as:
- Absenteeism
- Turnover
- Performance trends
- Internal mobility
- Manager feedback
- Workload indicators
Suppose one department reports low engagement and also has unusually high turnover.
That combination deserves attention.
HR can then investigate the underlying causes through employee conversations and manager discussions.
5. Helps Managers Give Better Feedback
Annual performance reviews can miss important changes during the year.
HR analytics can help managers monitor performance trends over time.
For example, a manager might notice:
January: Strong performance
February: Strong performance
March: Declining performance
April: Further decline
Instead of waiting for an annual review, the manager can discuss the change with the employee.
Perhaps the employee has received additional responsibilities, lacks resources, or needs help with a new task.
Early conversations can prevent small performance problems from becoming large ones.
Key HR Analytics Metrics to Track
Choosing the right metrics is more important than collecting huge amounts of data.
Here are some useful HR data analytics metrics.
1. Employee Turnover Rate
This measures how many employees leave the organization during a specific period.
A high turnover rate can increase recruitment and training costs and may signal deeper workforce issues.
2. Absenteeism Rate
Absenteeism measures employee absence over a specific period.
Tracking patterns by department, location, role, or time period can help HR identify areas that need investigation.
3. Performance Score
Performance scores can help organizations monitor employee results against defined expectations.
The scoring system should be consistent and clearly explained.
4. Training Effectiveness
Track whether training is associated with changes in:
- Skills
- Productivity
- Quality
- Customer satisfaction
- Performance outcomes
5. Employee Engagement
Engagement surveys can provide useful information about how employees experience their work.
The most valuable approach is to examine patterns and trends, not just one survey number.
6. Time to Productivity
This measures how long it takes a new employee to reach an expected level of performance.
It can help companies evaluate onboarding and training programs.
Real Example of HR Analytics in Action
Imagine a technology company with 500 employees.
Management notices that customer-support performance varies significantly between teams.
Instead of blaming individual employees, HR analyzes several months of data.
The analysis shows that high-performing teams tend to have:
- More frequent manager feedback
- Better access to training
- Lower employee turnover
- Clearer performance goals
The company decides to test several changes.
Managers receive coaching on regular feedback, employees get targeted training, and performance goals are clarified.
Over the following months, HR monitors customer satisfaction, employee performance, turnover, and engagement.
This is the core idea behind HR analytics:
Find a business problem → analyze relevant data → identify possible drivers → take action → measure the results.
The important lesson is that analytics is not simply about creating dashboards.
The value comes from using evidence to make better decisions.
How to Build an HR Analytics Strategy
You don’t need a huge analytics department to begin.
Follow these steps.
Step 1: Start With a Business Problem
Don’t begin by collecting every possible employee metric.
Start with a question.
For example:
“Why is employee turnover increasing in our customer-support department?”
A clear question gives your analysis direction.
Step 2: Choose Relevant Data
Collect only the information needed to investigate the problem.
Potential data sources include:
- HR information systems
- Performance management systems
- Employee surveys
- Learning platforms
- Attendance systems
- Recruitment systems
Make sure the data is accurate and collected for legitimate purposes.
Step 3: Look for Patterns
Compare results across meaningful groups and time periods.
For example:
- Department
- Job role
- Tenure
- Location
- Experience level
- Manager
- Training participation
But be careful.
Correlation does not automatically mean causation.
If employees who receive more training perform better, that does not prove training alone caused the improvement. High-performing employees may also be more likely to receive training.
Step 4: Turn Insights Into Action
Data has little value if nothing changes afterward.
If analytics identifies a performance gap, management should consider possible actions such as:
- Coaching
- Training
- Better workload distribution
- Clearer goals
- Improved onboarding
- Manager support
- Career development
Step 5: Measure the Results
After taking action, measure what happened.
Did performance improve?
Did turnover decrease?
Did engagement change?
Did productivity increase?
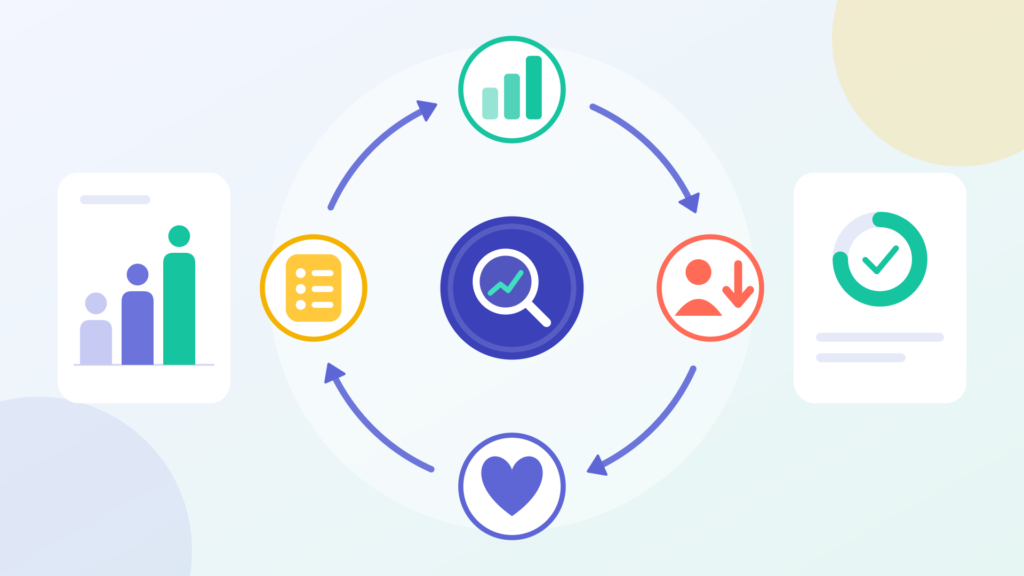
This creates a continuous improvement cycle.
Common Challenges in HR Analytics
HR analytics can be powerful, but it also comes with risks.
Poor Data Quality
Incorrect, incomplete, or outdated employee data can produce misleading results.
Solution: Establish clear data standards and regularly check data quality.
Privacy Concerns
Employee data is sensitive.
Organizations should collect and use data responsibly, limit access, protect personal information, and follow applicable privacy and employment laws.
Too Many Metrics
A dashboard containing 50 metrics may look impressive but provide little clarity.
Focus on metrics connected to specific business and workforce questions.
Employee Trust
Employees may become uncomfortable if they don’t understand how their data is being used.
Explain:
- What data is collected
- Why it is collected
- Who can access it
- How it supports workplace decisions
Transparency matters.
Best Practices for Using Employee Data
To make HR analytics useful and responsible:
- Use data to support people, not simply monitor them.
- Define performance measures clearly.
- Protect employee privacy.
- Avoid making important decisions from a single metric.
- Check data for bias and errors.
- Combine quantitative data with human feedback.
- Explain important decisions clearly.
- Focus on trends rather than isolated numbers.
- Measure whether HR interventions actually work.
The strongest HR analytics programs combine data, context, and human judgment.
The Future of HR Analytics
HR analytics is moving beyond simple reporting.
Modern organizations increasingly use analytics to understand workforce patterns, forecast potential staffing needs, identify skill gaps, and support workforce planning.
Artificial intelligence can also help HR teams process large amounts of information more quickly.
But technology doesn’t remove the need for responsible decision-making.
HR leaders still need to consider privacy, fairness, transparency, data quality, and employee trust.
The future of HR analytics is therefore not simply about collecting more data.
It’s about using the right data in the right way.
Frequently Asked Questions
What is HR analytics in simple words?
HR analytics means using employee data to understand workforce trends and make better HR decisions. It can help organizations improve performance, training, retention, hiring, and workforce planning.
How does HR analytics improve employee performance?
It can identify performance gaps, reveal training needs, improve goal-setting, help managers provide timely feedback, and measure whether development programs are producing useful results.
What are the most important HR analytics metrics?
Common metrics include employee turnover, absenteeism, performance, engagement, training effectiveness, time to productivity, and internal mobility. The right metrics depend on the organization’s goals.
Is HR analytics only for large companies?
No. Small businesses can use basic HR data to make better decisions. Even a simple spreadsheet tracking performance, turnover, attendance, training, and employee development can provide useful insights.
Can HR analytics replace HR managers?
No. Analytics provides evidence, but people make decisions. HR professionals still need context, communication, empathy, and judgment when dealing with employees.
Conclusion: Turn HR Data Into Better Employee Performance
HR analytics can change the way organizations understand employee performance.
Instead of relying only on assumptions, HR teams can use evidence to identify problems, understand workforce patterns, improve training, support managers, and create better employee development strategies.
But successful HR analytics isn’t about collecting the most data.
It’s about asking the right questions, using reliable information, protecting employee privacy, and turning insights into meaningful action.
If you’re an HR professional or business leader, start small.
Choose one important workforce problem, identify the data that can help explain it, take a focused action, and measure the result.
Start using your HR data today—and turn employee information into smarter workforce decisions.