
Introduction
Why do some students perform well while others struggle, even when they are taught by the same teacher?
Why do some students improve after extra classes, while others show little progress?
Schools and colleges collect huge amounts of information that can help answer these questions. Test scores, attendance records, assignment marks, survey responses, grades, and other student data can reveal important patterns.
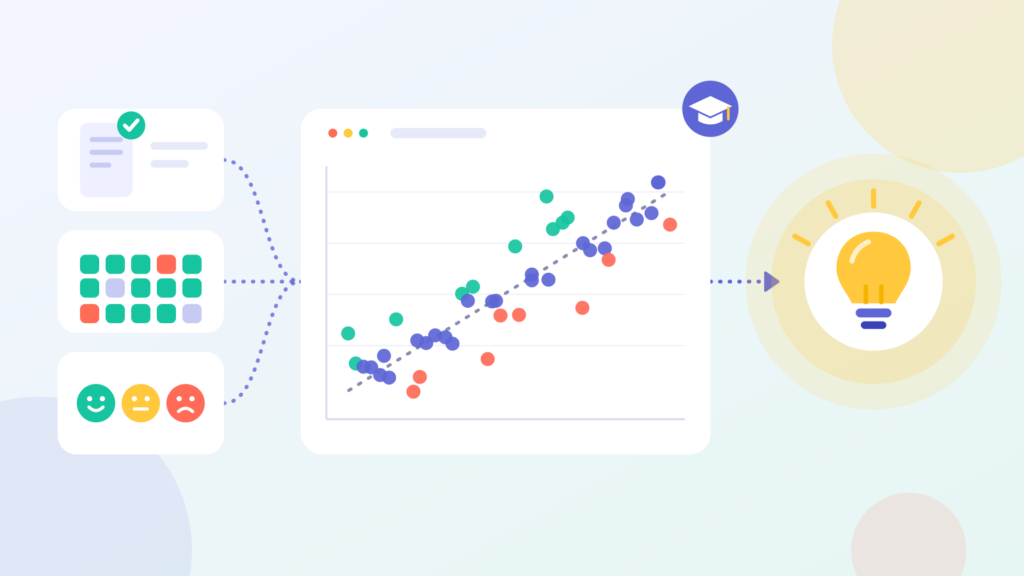
The challenge is knowing how to turn this data into useful information.
This is where education data analysis comes in.
By using statistics and data analysis techniques, educators can identify learning gaps, understand student behavior, evaluate teaching strategies, and make better decisions.
Instead of relying only on assumptions, teachers and administrators can use evidence to answer an important question:
What can we do to help students learn better?
In this article, we’ll explore how statistics can be used to analyze education data, improve student performance, identify struggling learners, and support better educational outcomes.
Table of Contents
- What Is Education Data Analysis?
- Why Data Analysis Matters in Education
- Types of Education Data
- How Statistics Can Improve Student Outcomes
- Important Statistical Methods in Education
- Real-World Example of Student Performance Analysis
- How to Conduct Education Data Analysis
- Common Challenges in Educational Data Analytics
- Best Practices for Using Student Data
- The Future of Education Data Analysis
- Frequently Asked Questions
- Conclusion
What Is Education Data Analysis?
Education data analysis is the process of collecting, organizing, analyzing, and interpreting data related to students, teachers, courses, and educational institutions.
The purpose is to find useful patterns that can support better educational decisions.
Education data may include:
- Exam and quiz scores
- Assignment grades
- Attendance
- Student demographics
- Course completion
- Learning activity
- Survey responses
- Homework performance
- Graduation rates
- Dropout rates
- Student engagement
For example, a teacher may notice that the average mathematics score has fallen from 72% to 61%.
Simply knowing that scores decreased isn’t enough.
Data analysis can help investigate why the decline happened.
Perhaps students struggled with one specific topic. Maybe attendance declined. Or students who missed certain lessons performed worse on the final assessment.
Statistics can help uncover these patterns.
Why Data Analysis Matters in Education
Educational decisions affect thousands of students.
Yet many decisions are still based on limited observations.
A teacher might think:
“Most students understand this topic.”
But what if the test results show that only 55% answered the questions correctly?
Data provides another perspective.
Education data analysis can help schools:
- Identify students who need additional support
- Find difficult topics
- Measure learning progress
- Evaluate teaching interventions
- Improve curriculum planning
- Understand attendance patterns
- Monitor student engagement
- Allocate resources more effectively
The goal isn’t to turn education into numbers.
The goal is to use numbers to better understand the people behind them.
Types of Education Data
Before analyzing data, it’s important to understand what information is available.
1. Academic Performance Data
This includes:
- Test scores
- Exam results
- Assignment grades
- Quiz marks
- Project scores
- Course grades
This is one of the most common forms of student performance data.
2. Attendance Data
Attendance can help educators identify patterns.
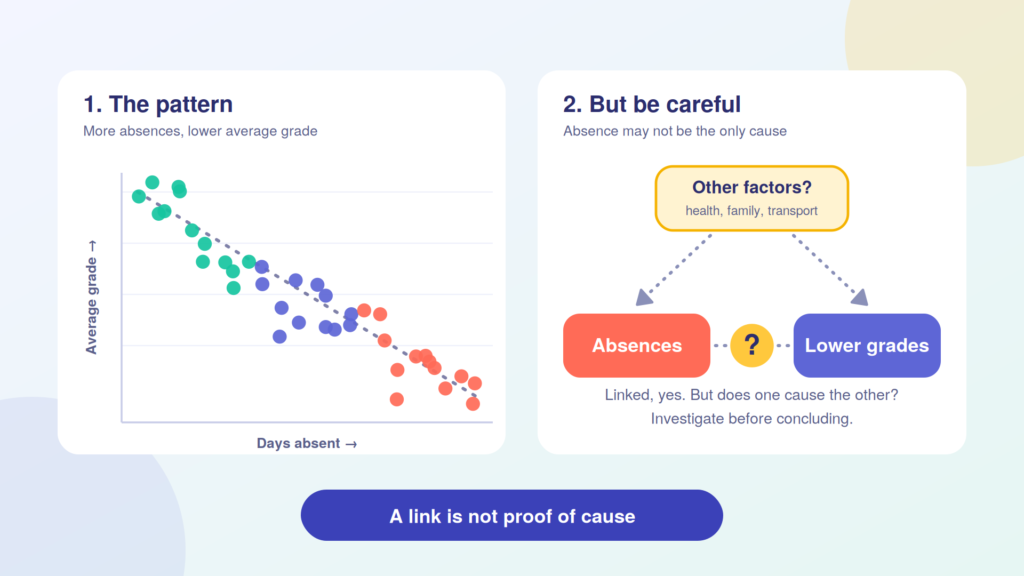
For example, a school might discover that students with frequent absences also tend to have lower average grades.
However, this relationship should be investigated carefully rather than assuming that absence alone caused lower performance.
3. Student Engagement Data
Engagement can be measured through:
- Class participation
- Online learning activity
- Homework completion
- Learning platform activity
- Student surveys
These measures can provide additional context around academic results.
4. Demographic and Background Data
Depending on the purpose and applicable privacy rules, schools may analyze information such as:
- Age
- Grade level
- Location
- Socioeconomic indicators
- Previous academic performance
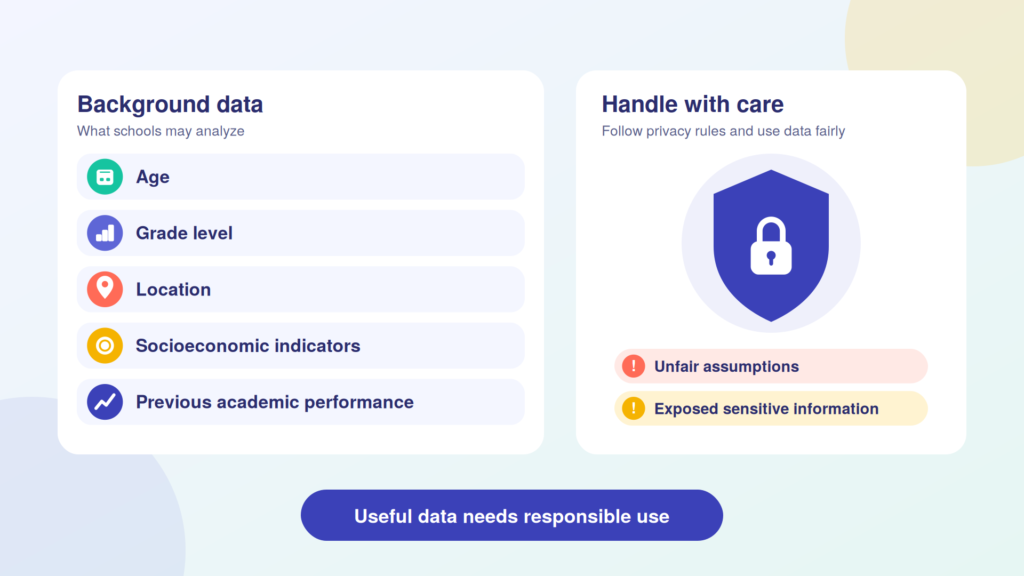
Such data should be handled carefully because inappropriate analysis can create unfair assumptions or expose sensitive information.
How Statistics Can Improve Student Outcomes
Statistics gives educators practical tools for understanding student performance.
1. Identify Learning Gaps
Suppose a mathematics class takes a test with five major topics.
The average scores are:
| Topic | Average Score |
|---|---|
| Algebra | 82% |
| Geometry | 76% |
| Fractions | 58% |
| Statistics | 74% |
| Equations | 79% |
The results immediately highlight a possible problem.
Students performed much worse on fractions.
Instead of spending equal time on every topic, the teacher can investigate the fractions unit and provide additional practice.
This is a simple example of data-driven teaching.
2. Track Student Progress Over Time
One test gives only a snapshot.
Multiple assessments provide a clearer picture of progress.
For example:
Test 1: 55%
Test 2: 63%
Test 3: 71%
Test 4: 78%
This trend suggests improvement.
Teachers can use progress data to determine whether students are moving toward learning goals.
The same approach can identify students whose performance is declining.
3. Find At-Risk Students Earlier
One of the valuable uses of educational data analytics is identifying students who may need additional support.
Consider a student with:
- Falling grades
- Increasing absences
- Low assignment completion
- Reduced class participation
Each indicator alone may not tell the whole story.
Together, they may signal that the student needs attention.
A teacher can then speak with the student, understand the underlying issue, and connect them with appropriate support.
Early identification can create an opportunity for early intervention.
Important Statistical Methods in Education
You don’t need advanced mathematics to begin analyzing education data.
Several basic statistical techniques are highly useful.
Mean
The mean, or average, summarizes the typical score in a group.
For example:
Student scores:
60, 70, 75, 80, 90
Mean:
75
Teachers can use averages to compare class performance across tests or subjects.
Median
The median is the middle value when data is arranged from smallest to largest.
It can be useful when a dataset contains unusually high or low values.
For example:
40, 55, 60, 65, 95
The median is 60.
Standard Deviation
Standard deviation shows how spread out student scores are around the average.
Imagine two classes both have an average score of 70%.
Class A has scores clustered around 70.
Class B has students scoring from 30% to 95%.
Both classes have the same average, but their performance patterns are very different.
Standard deviation helps reveal this difference.
Correlation
Correlation measures the strength and direction of a relationship between variables.
For example, an educator might examine the relationship between:
Attendance ↔ Exam Performance
If students with higher attendance generally have higher scores, the variables may show positive correlation.
But remember:
Correlation does not prove causation.
Other factors may influence both attendance and performance.
Regression Analysis
Regression can help researchers examine how one outcome is associated with one or more explanatory variables.
For example, researchers might analyze whether student performance is associated with factors such as:
- Previous grades
- Attendance
- Study time
- Assignment completion
Regression can be particularly useful when several variables need to be considered together.
Real-World Example of Student Performance Analysis
Imagine a college has noticed that first-year students are receiving lower mathematics grades than expected.
The administration collects data from 500 students.
The dataset includes:
- Previous mathematics grade
- Attendance percentage
- Assignment completion
- Midterm score
- Final examination score
After analyzing the data, researchers notice that students with lower assignment completion tend to have lower final scores.
The college decides to investigate further.
Instead of simply telling students to “study harder,” teachers introduce:
- Weekly practice exercises
- Earlier feedback
- Additional support sessions
- Progress monitoring
The college then compares performance before and after the intervention.
This illustrates an important principle:
Data analysis should lead to action and evaluation.
Collecting statistics isn’t the final goal.
Improving learning is.
How to Conduct Education Data Analysis
A simple education data analysis process can follow these steps.
Step 1: Define the Question
Start with a clear question.
For example:
“Why are students struggling with mathematics?”
A focused question makes the analysis more useful.
Step 2: Collect Relevant Data
Gather information that can help answer the question.
This could include grades, attendance, assignment completion, surveys, or assessment results.
Step 3: Clean the Data
Educational datasets often contain:
- Missing values
- Duplicate records
- Incorrect entries
- Different formats
Clean data is essential for reliable analysis.
Step 4: Explore the Data
Calculate basic statistics such as:
- Mean
- Median
- Minimum
- Maximum
- Standard deviation
Then use charts and tables to identify patterns.
Step 5: Analyze Relationships
Depending on the question, researchers may use:
- Correlation
- Regression
- Hypothesis testing
- Group comparisons
- Trend analysis
Step 6: Take Action
Turn findings into practical interventions.
For example:
Finding: Students struggle with fractions.
Action: Introduce targeted practice and additional instruction.
Step 7: Measure the Result
After the intervention, analyze new data.
Did scores improve?
Did attendance change?
Did assignment completion increase?
This creates a continuous improvement process.
Common Challenges in Educational Data Analytics
Education data analysis isn’t always straightforward.
Poor Data Quality
Incorrect or missing information can lead to misleading results.
Solution: Create consistent data collection and validation procedures.
Too Much Data
Schools may collect more information than they actually need.
More data doesn’t automatically mean better decisions.
Focus on data connected to meaningful questions.
Privacy Concerns
Student information must be handled responsibly.
Schools and researchers should follow applicable privacy laws, institutional policies, and ethical standards.
Only authorized people should have access to sensitive information.
Misinterpreting Statistics
A statistical relationship does not automatically explain why something happened.
For example, if attendance and grades are correlated, that doesn’t prove that increasing attendance alone will produce a specific increase in grades.
Statistical findings require context.
Best Practices for Using Student Data
To use education data responsibly and effectively:
- Start with a clear question.
- Use reliable and relevant data.
- Check data quality before analysis.
- Don’t rely on a single metric.
- Look at trends over time.
- Consider differences between student groups carefully.
- Protect student privacy.
- Avoid labeling students based only on predictions.
- Combine statistical evidence with teacher and student perspectives.
- Measure the impact of interventions.
The best education data analysis supports teachers rather than replacing their professional judgment.
The Future of Education Data Analysis
Technology is changing how schools collect and analyze educational information.
Learning management systems, online assessments, and digital learning platforms can generate large amounts of data.
Advanced analytics and artificial intelligence can help identify patterns in this information.
For example, systems may help educators identify:
- Students falling behind
- Difficult learning materials
- Common mistakes
- Skill gaps
- Changes in engagement
But technology must be used responsibly.
Educational institutions need to consider privacy, fairness, transparency, data quality, and the risk of unfairly labeling students.
The goal should always be better learning—not simply better dashboards.
Frequently Asked Questions
What is education data analysis?
Education data analysis is the process of examining student, teacher, and institutional data to identify patterns and support better educational decisions.
How does statistics improve student performance?
Statistics can help educators identify learning gaps, monitor progress, evaluate interventions, understand performance patterns, and identify students who may need additional support.
What statistical methods are commonly used in education?
Common methods include mean, median, standard deviation, correlation, regression, hypothesis testing, and trend analysis.
What is student performance analysis?
Student performance analysis involves examining academic results and related information to understand how students are progressing and where additional support may be needed.
Can small schools use education data analysis?
Yes. A school doesn’t need a large data science department. Basic information such as test scores, attendance, assignment completion, and progress over time can provide useful insights.
Conclusion
Education data analysis gives teachers and educational institutions a clearer way to understand student performance.
Instead of relying only on assumptions, educators can use statistics to identify learning gaps, monitor progress, evaluate interventions, and provide targeted support.
The process is simple:
Ask the right question → collect useful data → analyze the patterns → take action → measure the results.
But numbers should never tell the entire story.
A student’s performance can be influenced by many academic, social, personal, and environmental factors. Statistics provides evidence, while teachers and education professionals provide the human context.
When these two work together, data becomes more than numbers.
It becomes a tool for helping students learn, improve, and reach their potential.
Ready to use data in education?
Start with one question about student performance in your classroom or institution. Collect the relevant data, analyze the results, and use what you learn to test a practical improvement.
Better questions lead to better data. Better data can lead to better educational decisions.