
Correlation Isn’t Causation: How to Actually Prove Causal Relationships
We’ve all heard the phrase: “Correlation does not imply causation.” It is the first rule of statistics and the ultimate buzzkill for anyone who wants to claim their new marketing campaign doubled sales.
But let’s be honest—knowing the rule doesn’t make it easy to follow. As humans, we are pattern-seeking machines. When we see two things happening at the same time, our brains scream, “Aha! One caused the other!”
In the world of data and business, this cognitive bias can lead to expensive mistakes. You might pour millions into a strategy that was never actually responsible for the growth, or worse, you might ignore a critical factor because you were looking at the wrong variable.
So, how do we move past the surface level? How do we stop guessing and start proving?
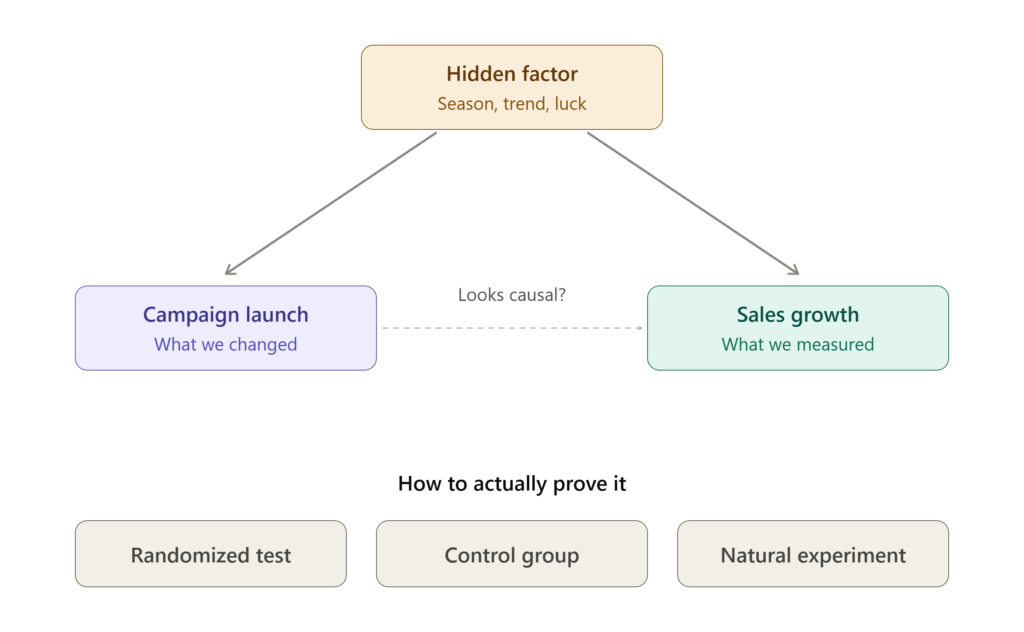
Here is a guide on why our brains get fooled and, more importantly, how to actually prove causal relationships.
The Trap of the “Third Variable”
Before we talk solutions, we need to understand the trap. Why do we confuse correlation with causation?
The most common reason is a confounding variable (or a “third variable”). This is a hidden factor that influences both the cause and the effect you are observing.
The Classic Example:
You might notice that ice cream sales and shark attacks correlate perfectly. When ice cream sales go up, shark attacks go up. Does ice cream attract sharks? No. The confounding variable is summer. The heat drives people to buy ice cream and also drives people into the water, where they encounter sharks.
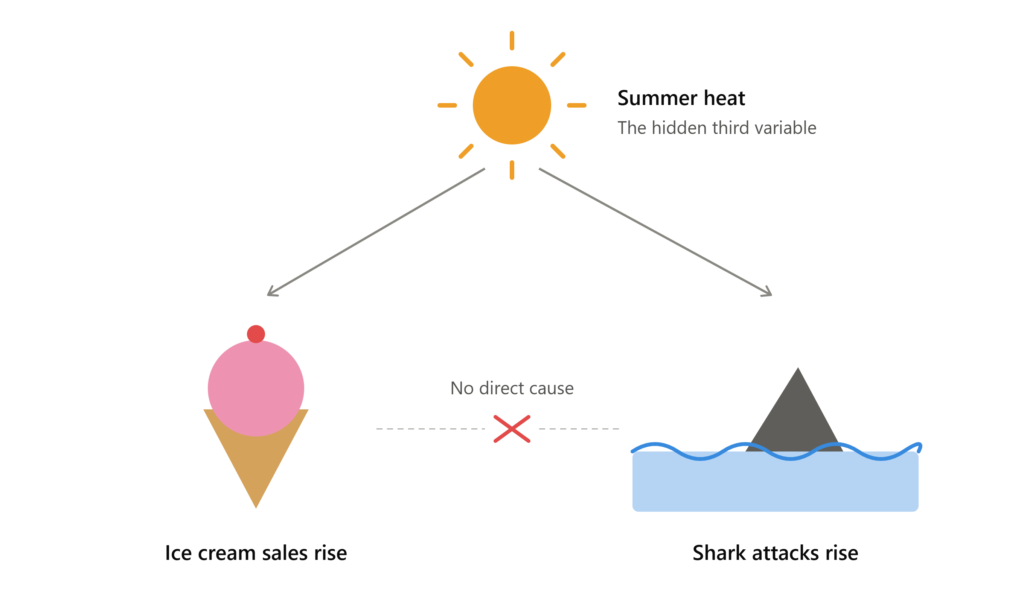
If you acted on the “Ice Cream Theory,” you’d be wasting time trying to ban ice cream to save surfers.
The Gold Standard: The Randomized Controlled Experiment (A/B Test)
If you want to prove causation, you have to isolate the variable. The only way to do this with near certainty is through a Randomized Controlled Trial (RCT) .
In the business world, we call this an A/B Test.
To prove that X causes Y, you must:
- Randomly assign subjects (users, customers, plants) into two groups.
- Control the environment so that everything else is identical.
- Intervene: Give Group A the treatment (the cause) and Group B a placebo or no treatment.
- Measure the difference in outcomes (the effect).
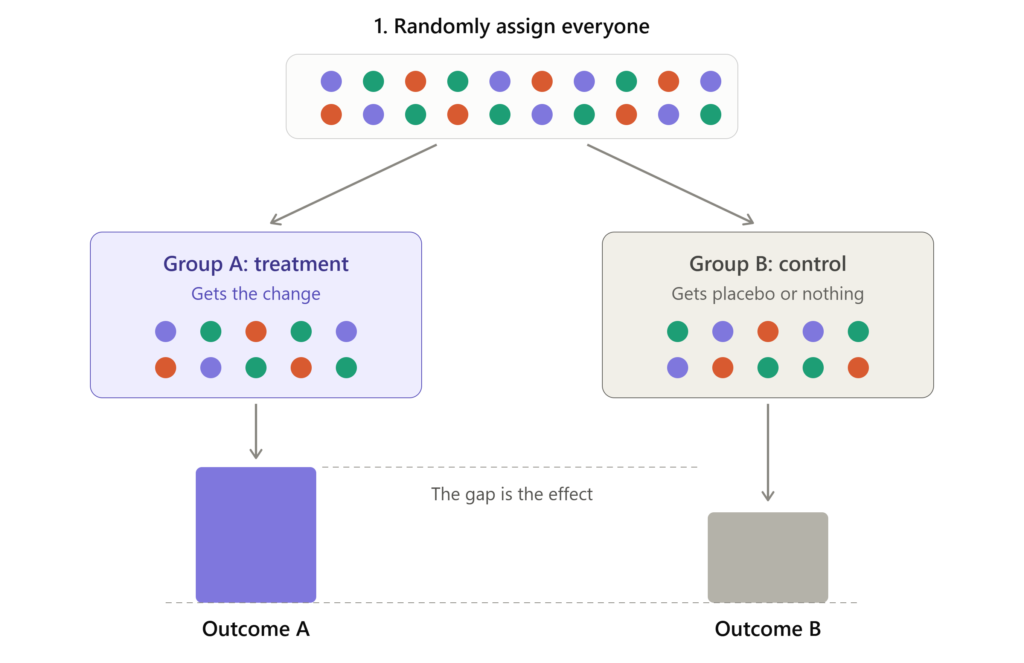
Why it works: Randomization ensures that other confounding variables (age, location, income, etc.) are distributed evenly across both groups. If Group A sees a statistically significant improvement over Group B, you can be confident that your intervention caused it.
When You Can’t Run an A/B Test: Observational Methods
Sometimes, A/B testing is impossible. You can’t randomly assign half your customers to get a recession and the other half to get a booming economy. You can’t randomly assign people to smoke cigarettes to see if it causes cancer.
In these cases, you have to rely on observational studies and quasi-experimental designs. These aren’t as bulletproof as an RCT, but they are powerful tools for proving causality in complex systems.
Here are three methods to know:
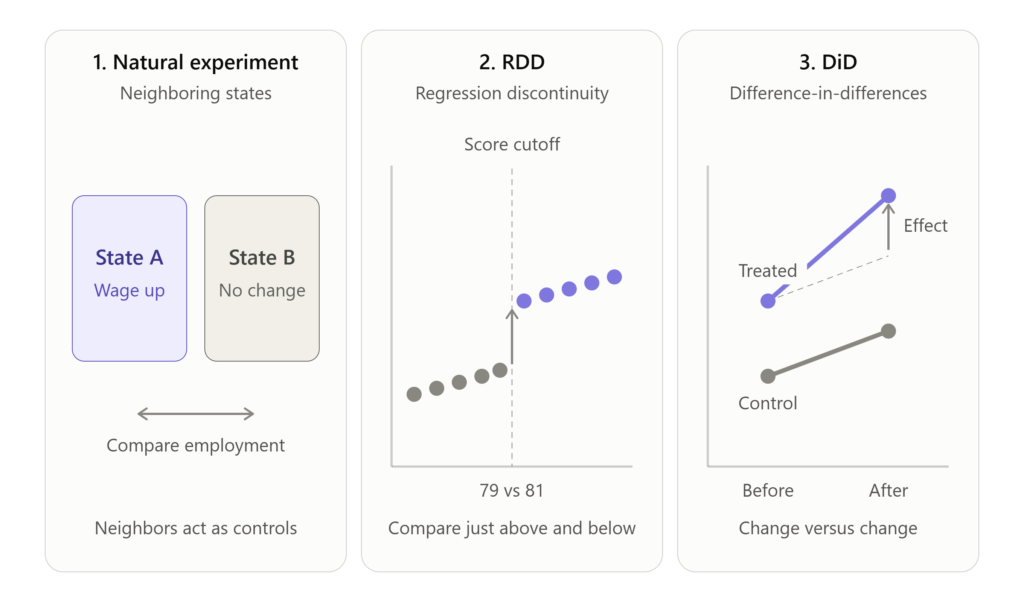
1. Natural Experiments
Sometimes, the world acts like a laboratory. A natural experiment occurs when external forces create a treatment and control group that mimic a randomized trial.
- Example: If a state raises its minimum wage and a neighboring state doesn’t, you can compare the employment rates in those two states to see the effect of the wage increase.
2. Regression Discontinuity Design (RDD)
This is a powerful tool for policy analysis. It looks at a specific cutoff point.
- Example: If students need a score of 80 to get a scholarship, you compare students who scored a 79 (control) with those who scored an 81 (treatment). Because the difference in their scores is negligible, any significant difference in their future outcomes is likely caused by the scholarship.
3. Difference-in-Differences (DiD)
This compares the change in outcomes over time between a group that was “treated” and a group that was not. It subtracts the change in the control group from the change in the treatment group to account for trends.
The Checklist for Proving Causation
If you want to claim that A causes B, you need to satisfy three criteria:
- Temporal Precedence: The cause must happen before the effect. (You can’t treat the symptom before the disease exists).
- Covariation: When A changes, B must change. If you turn the knob for A, B should move.
- Non-Spuriousness: You must rule out confounding variables. This is the hardest part. Can you prove that nothing else is causing the change?
The Bottom Line
Data is powerful, but it is also dumb. It will show you patterns whether they are meaningful or coincidental.
If you want to make smart decisions, stop looking at charts and asking, “Do these look similar?” Start asking, “Did I isolate the variable?” and “What else could be causing this?”
Proving causation is hard work. It requires rigorous testing and skepticism. But in a world full of noise, the person who can identify the true signal—the actual cause—is the one who wins.
Are you ready to move beyond the correlation and start measuring true impact?