
You’ve collected your data, and you’re ready to run a t-test. Then you plot a histogram and see a lopsided pile of values with a few extreme outliers. Now what?
This is where non-parametric tests come in. They’re among the most useful and most misunderstood tools in statistics. This post explains what they are, when they beat their parametric counterparts, and when they don’t.
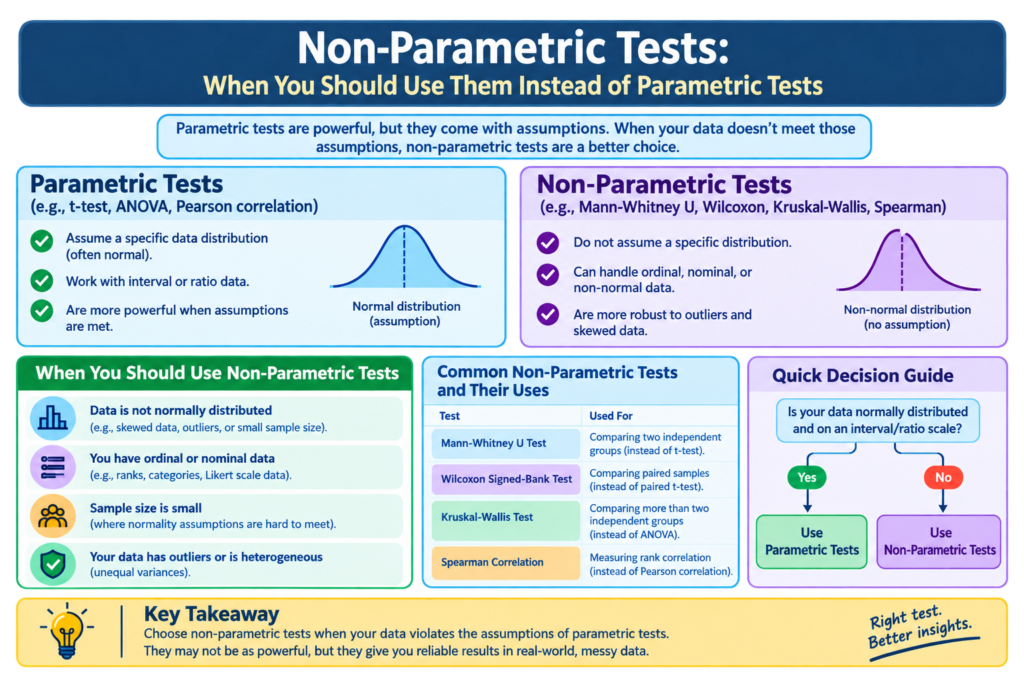
Parametric vs. Non-Parametric: The Core Difference
Parametric tests (t-tests, ANOVA, Pearson correlation) assume your data comes from a specific distribution, usually the normal distribution, and they make claims about parameters like the mean and standard deviation.
Non-parametric tests (Mann-Whitney U, Wilcoxon signed-rank, Kruskal-Wallis, Spearman correlation) make far fewer assumptions about the shape of your data. Many work with the ranks of values instead of the raw values, which makes them resistant to outliers and odd distributions.
Think of it this way: a parametric test is a tailored suit. It fits beautifully when your data matches the assumed shape. A non-parametric test is a well-made jacket in a standard size. It fits a much wider range of bodies, though not quite as sharply.
Five Situations Where Non-Parametric Tests Are the Better Choice
1. Your sample is small and clearly non-normal
With 10 or 15 observations, you can’t lean on the Central Limit Theorem to rescue you. If the data looks skewed or has a strange shape, a t-test’s p-values can be unreliable. Rank-based tests hold up better here.
2. Your data is ordinal
Likert scales (“strongly disagree” to “strongly agree”), pain ratings, and satisfaction rankings tell you the order of responses, but the gaps between categories aren’t necessarily equal. Averaging them, as parametric tests do, assumes an interval scale you may not have. Non-parametric tests respect the ordering without pretending the spacing is uniform.
3. You have outliers you can’t justify removing
A single extreme value can drag a mean and inflate a standard deviation, distorting a t-test. Because rank-based tests only care whether a value is bigger or smaller than others, not how much bigger, an outlier has limited influence. Whether the outlier is a data-entry error or a genuine observation matters here, so investigate it before deciding.
4. Your data is heavily skewed
Income, reaction times, hospital stays, and website session durations are classic right-skewed variables. When a transformation (like a log) doesn’t fix the shape, or you’d rather not transform, a non-parametric test is a sensible alternative.
5. Your data has a natural ceiling or floor
Scores that pile up at 0 or at a maximum (think test scores where many people get full marks) violate normality in ways that are hard to fix. Rank-based methods cope better.
A Quick Translation Table
| Parametric test | Non-parametric alternative | Typical use |
|---|---|---|
| Independent samples t-test | Mann-Whitney U (Wilcoxon rank-sum) | Compare two independent groups |
| Paired t-test | Wilcoxon signed-rank test | Compare two related measurements (before/after) |
| One-way ANOVA | Kruskal-Wallis test | Compare three or more independent groups |
| Repeated-measures ANOVA | Friedman test | Compare three or more related measurements |
| Pearson correlation | Spearman’s rank correlation | Measure association between two variables |
A Practical Example
Suppose you’re comparing customer satisfaction ratings (1 to 5) between two versions of a checkout page, with 18 responses each. The data is ordinal, the samples are small, and most ratings cluster at 4 and 5.
A t-test would treat those ratings as evenly spaced numbers and assume normality, and neither assumption is comfortable here. A Mann-Whitney U test compares the ranks of ratings across the two groups and asks whether one group tends to produce higher values than the other. It’s the more defensible choice.
The Trade-Offs You Should Know About
Non-parametric tests aren’t a free upgrade. Keep these points in mind:
- Slightly less power when assumptions hold. If your data really is normal, a t-test is better at detecting true effects. In practice, the loss is often modest (the Wilcoxon test is about 95% as efficient as the t-test under normality), and non-parametric tests can be more powerful when data is heavy-tailed or skewed.
- They answer a slightly different question. A t-test compares means. Mann-Whitney doesn’t strictly compare medians; it tests whether values from one group tend to be larger than values from the other. This is a subtle but important distinction when you report results.
- They’re less informative about effect size by default. Pair your p-value with an effect size suited to ranks, such as the rank-biserial correlation, the probability of superiority, or the Hodges-Lehmann estimate.
- Ties can complicate things. Lots of repeated values, common with ordinal scales, require tie corrections, which good software handles automatically.
Common Mistakes to Avoid
Assuming large samples always need non-parametric tests, or never do. With large samples, the Central Limit Theorem often makes t-tests robust to non-normality. But it doesn’t save you from extreme skew, heavy outliers, or inherently ordinal data.
Choosing the test based only on a normality test. Tests like Shapiro-Wilk are oversensitive with big samples and underpowered with small ones. Look at plots (histograms, Q-Q plots) and think about how the data was generated.
Switching tests until you get significance. Pick your analysis approach based on your data’s properties and research question, ideally before looking at results.
A Simple Decision Guide
Ask yourself:
- Is the outcome ordinal or ranked? Use non-parametric.
- Is the sample small and visibly non-normal? Use non-parametric.
- Are there influential outliers you can’t legitimately remove? Consider non-parametric.
- Is the sample large and the distribution roughly symmetric? A parametric test is likely fine.
- Still unsure? Run both. If they agree, you can report with confidence. If they disagree, dig into why, and lean on the one whose assumptions your data actually meets.
Key Takeaways
- Non-parametric tests trade a small amount of power for much greater flexibility.
- They shine with small samples, ordinal data, outliers, and skewed distributions.
- Every common parametric test has a non-parametric cousin.
- Report effect sizes, and be precise about what your test actually compares.
- Choose your method based on your data’s structure, not on which one gives the result you want.
Statistics isn’t about picking the “fanciest” test. It’s about picking the one whose assumptions your data can honestly meet. When your data refuses to behave normally, non-parametric tests give you a rigorous way forward.