
Every day, banks and financial institutions process millions of transactions. Behind each payment, transfer, loan application, and account activity is a valuable source of data.
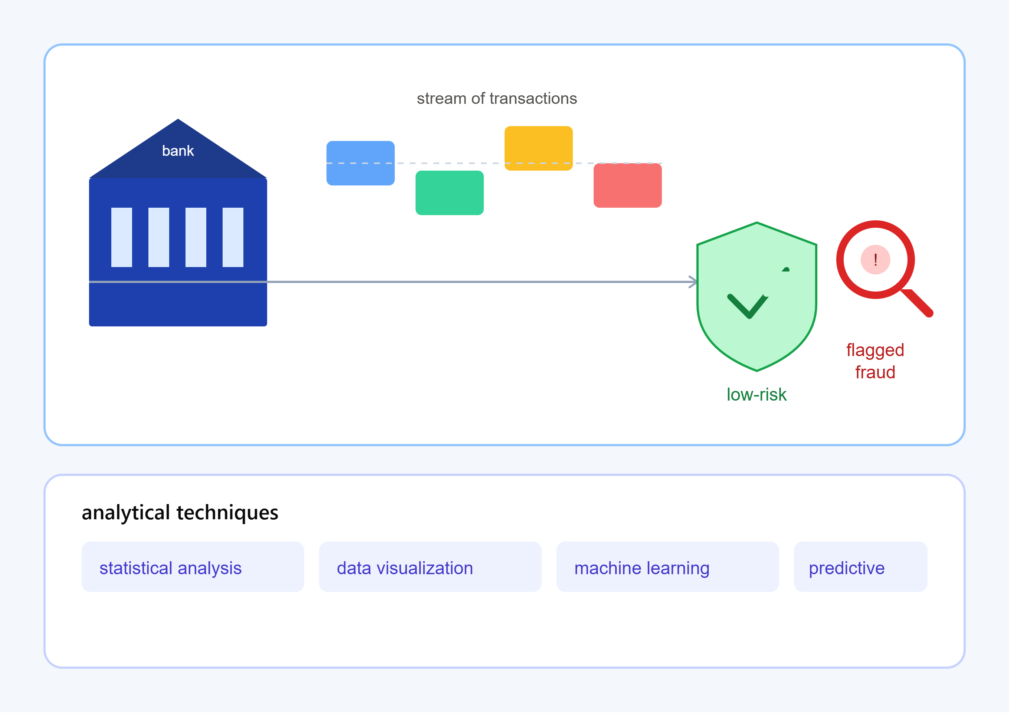
But financial data is not only useful for understanding customers and business performance. It can also help banks answer two critical questions:
How much risk does a customer or transaction represent?
Could this transaction be fraudulent?
This is where banking and finance analytics becomes important.
By using statistical analysis, data visualization, machine learning, and predictive modeling, financial institutions can identify unusual patterns, evaluate credit risk, detect suspicious transactions, and make more informed decisions.
In this blog, we will explore the basics of risk and fraud detection in banking, the types of data involved, common analytical techniques, and some of the challenges financial institutions face.
What Is Banking & Finance Analytics?
Banking and finance analytics refers to the use of data and analytical techniques to understand financial activities and support decision-making.
Banks can analyze data related to:
- Customer transactions
- Loan applications
- Credit histories
- Account activity
- Payment behavior
- Income and financial information
- Investment portfolios
- ATM and card transactions
- Digital banking activity
Analytics can be used for many purposes, including:
- Credit scoring
- Fraud detection
- Risk assessment
- Customer segmentation
- Loan default prediction
- Financial forecasting
- Anti-money-laundering monitoring
- Customer behavior analysis
Among these applications, risk management and fraud detection are particularly important.
What Is Financial Risk?
Financial risk is the possibility that a financial institution may experience a loss or an unfavorable outcome.
Banks face different types of risk.
1. Credit Risk
Credit risk is the possibility that a borrower will fail to repay a loan or other financial obligation.
For example, a bank provides a personal loan to a customer.
If the customer stops making payments, the bank may experience a financial loss.
Analytics can help estimate the likelihood of default before a loan is approved.
2. Market Risk
Market risk arises when changes in financial markets affect the value of investments or financial positions.
Examples include changes in:
- Interest rates
- Currency exchange rates
- Stock prices
- Commodity prices
Financial institutions use data and statistical models to monitor and manage exposure to these changes.
3. Operational Risk
Operational risk can result from problems involving:
- Internal processes
- Employees
- Technology
- Systems
- External events
For example, a system failure could prevent customers from accessing online banking services.
Analytics can help institutions identify patterns associated with operational problems.
4. Liquidity Risk
Liquidity risk occurs when an institution does not have sufficient liquid resources to meet its financial obligations when they become due.
Banks therefore monitor cash flows, deposits, withdrawals, and other financial indicators to manage liquidity.
Why Is Risk Analytics Important?
A bank cannot eliminate every financial risk.
Instead, it needs to identify, measure, monitor, and manage risk.
Risk analytics can help answer questions such as:
- Which borrowers are more likely to default?
- How much credit should be extended?
- Which accounts show unusual behavior?
- How could changing interest rates affect the institution?
- Which transactions require additional investigation?
The answers can support risk-management processes and help institutions allocate resources more effectively.
What Is Fraud Detection?
Fraud detection is the process of identifying transactions or activities that may involve deception, unauthorized activity, or financial misconduct.
Examples can include:
- Unauthorized card transactions
- Account takeover
- Identity-related fraud
- Suspicious transfers
- Application fraud
- Payment fraud
Fraud detection systems analyze transactions and other information to identify patterns that may require investigation.
Importantly, an analytical system usually identifies suspicious activity, not automatically proven fraud. A transaction flagged by a model may be legitimate and may require further review.
How Does Fraud Detection Work?
A simplified fraud-detection process looks like this:
Transaction Data
↓
Data Processing
↓
Feature Generation
↓
Risk/Fraud Model
↓
Risk Score or Alert
↓
Human/Automated Review
↓
Action
For example, a transaction-monitoring system might examine:
- Transaction amount
- Transaction time
- Location
- Device information
- Previous transaction history
- Transaction frequency
- Merchant information
The system then looks for behavior that differs from expected patterns.
1. Rule-Based Fraud Detection
One of the simplest approaches is a rule-based system.
A bank might establish rules such as:
Flag transactions that meet a particular combination of predefined conditions.
For example:
- Unusually large transaction
- Multiple transactions within a very short period
- Sudden change in geographic activity
- Multiple failed authentication attempts
Rules are relatively easy to understand and implement.
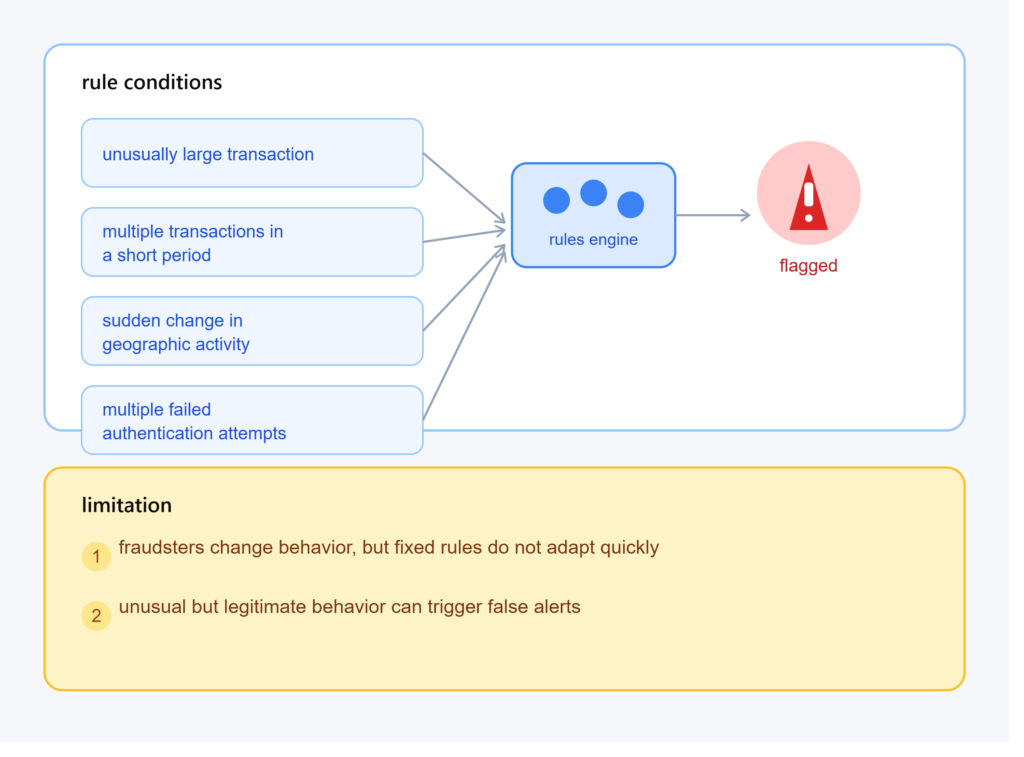
Limitation
Fraudsters can change their behavior, while fixed rules may not adapt quickly.
A rule can also generate false alerts when a legitimate customer behaves unusually.
2. Statistical Analysis
Statistical techniques can help identify transactions that differ from historical behavior.
For example, suppose a customer’s typical transactions are between $20 and $200.
Suddenly, the account records several transactions worth thousands of dollars.
This does not prove fraud, but the unusual behavior may deserve additional attention.
Methods such as:
- Descriptive statistics
- Probability models
- Distribution analysis
- Correlation analysis
- Regression
can help researchers understand financial behavior.
3. Anomaly Detection
Anomaly detection focuses on identifying observations that are unusual compared with expected patterns.
Consider a customer who normally:
- Shops in one region
- Makes five transactions per week
- Uses the same device
Suddenly:
- The account is accessed from a different region.
- Twenty transactions occur within an hour.
- A new device is used.
The combination of changes may be considered anomalous.
Machine-learning algorithms can be used to identify such patterns automatically.
4. Machine Learning for Fraud Detection
Machine learning can analyze large amounts of historical transaction data and learn patterns associated with suspicious activity.
Two common approaches are:
Supervised Learning
The model is trained using labeled examples.
For example:
Transaction → Legitimate
Transaction → Fraudulent
Algorithms that may be used include:
- Logistic regression
- Decision trees
- Random forests
- Gradient boosting
- Neural networks
The model learns patterns from historical data and uses them to classify new transactions.
Unsupervised Learning
In some situations, there may not be enough reliable fraud labels.
Unsupervised techniques can instead search for unusual patterns or clusters.
Examples include:
- Clustering
- Isolation-based methods
- Dimensionality reduction
- Density-based approaches
These methods can help identify potentially unusual behavior that deserves further investigation.
Risk Scoring in Banking
Instead of simply saying “risk” or “no risk,” financial institutions often use risk scores.
For example:
| Customer | Risk Score | Possible Interpretation |
|---|---|---|
| A | 15 | Lower estimated risk |
| B | 48 | Moderate estimated risk |
| C | 82 | Higher estimated risk |
The exact scoring system depends on the institution and application.
Risk scores can be used in areas such as:
- Credit assessment
- Transaction monitoring
- Fraud screening
- Customer risk management
A score is an analytical output, not a guarantee of what will happen.
Credit Risk and Loan Default Prediction
One important application of banking analytics is predicting whether borrowers may fail to repay loans.
A dataset might contain variables such as:
- Age
- Income
- Employment history
- Existing debt
- Credit history
- Loan amount
- Loan duration
- Previous repayment behavior
A statistical or machine-learning model can use these variables to estimate default risk.
For example:
Customer Data
↓
Feature Engineering
↓
Credit Risk Model
↓
Probability of Default
↓
Credit Decision Process
Financial institutions can then incorporate model results into their broader credit-risk procedures.
Key Metrics for Fraud Detection
Accuracy alone is not enough when evaluating a fraud-detection model.
Consider a system that examines 100,000 transactions, of which only 500 are fraudulent.
A model could classify almost everything as legitimate and still achieve very high accuracy while failing to detect many fraudulent transactions.
Important metrics include:
Precision
Of the transactions flagged as fraud, how many were actually fraudulent?
Recall
Of all fraudulent transactions, how many did the system identify?
Specificity
How well does the model identify legitimate transactions?
F1-Score
A combined measure based on precision and recall.
ROC-AUC
A metric commonly used to evaluate classification performance across different decision thresholds.
The appropriate metric depends on the financial and operational consequences of false positives and false negatives.
The Problem of False Positives
One major challenge in fraud detection is the false positive.
A false positive occurs when a legitimate transaction is incorrectly flagged as suspicious.
For example, imagine a customer travels internationally and makes a purchase from a new location.
The transaction may look unusual compared with the customer’s normal behavior, but it could be completely legitimate.
Too many false alerts can:
- Frustrate customers
- Increase investigation costs
- Delay legitimate transactions
- Overload fraud-investigation teams
Therefore, effective fraud analytics needs to balance fraud detection with the reduction of unnecessary alerts.
Data Quality: The Foundation of Financial Analytics
Financial models are only as reliable as the data used to build them.
Common data problems include:
- Missing values
- Duplicate transactions
- Incorrect timestamps
- Inconsistent customer information
- Incorrect transaction categories
- Data from disconnected systems
Before developing a fraud or risk model, analysts should perform careful data cleaning and validation.
A simple principle applies:
Garbage in, garbage out.
A sophisticated algorithm cannot automatically fix fundamentally unreliable data.
Feature Engineering
Feature engineering involves transforming raw financial information into variables that can be more useful for analysis.
For example, instead of using only:
Transaction Amount = $2,000
an analyst might create additional features such as:
- Average transaction amount
- Number of transactions in the last hour
- Number of transactions in the last 24 hours
- Difference from customer’s normal spending
- Time since previous transaction
- Number of locations used recently
These features can provide additional information about transaction behavior.
Real-Time Fraud Detection
Modern digital banking requires many transactions to be assessed very quickly.
A simplified real-time system might work like this:
Customer Makes Payment
↓
Transaction Data Captured
↓
Fraud Model Evaluates Transaction
↓
Risk Score Generated
↓
Transaction Approved, Declined, or Sent for Review
The challenge is to perform useful analysis without introducing unacceptable delays into legitimate transactions.
Data Privacy and Security
Banking analytics involves highly sensitive financial information.
Organizations therefore need strong controls around:
- Data access
- Authentication
- Encryption
- Data storage
- Monitoring
- Data sharing
- Retention
Researchers and analysts should also follow applicable financial, privacy, security, and research requirements.
Data should only be used for legitimate purposes and handled according to the relevant rules and policies.
Explainability in Financial Models
A complex machine-learning model may produce an accurate prediction but make it difficult to understand why a particular transaction or customer received a certain risk score.
This can create challenges for financial institutions.
For example:
“The model classified this customer as high risk.”
may not be enough information for an analyst or decision-maker.
Explainability techniques can help identify which factors contributed to a model’s output.
This is especially important when analytical models support decisions that can significantly affect customers.
A Simple Banking Analytics Example
Imagine a bank wants to identify potentially suspicious debit-card transactions.
The dataset contains:
- Customer ID
- Transaction amount
- Date and time
- Merchant category
- Location
- Device information
- Previous transaction history
- Fraud label
Step 1: Clean the Data
Remove duplicate records and correct obvious data errors.
Step 2: Explore the Data
Examine transaction amounts, frequencies, locations, and time patterns.
Step 3: Create Features
Calculate variables such as:
- Average spending
- Transaction frequency
- Distance from previous transaction
- Number of transactions within a short period
Step 4: Build a Model
Train an appropriate classification or anomaly-detection model.
Step 5: Evaluate Performance
Measure precision, recall, false-positive rates, and other relevant metrics.
Step 6: Validate
Test the model on data it did not use for training.
Step 7: Monitor
Continue monitoring performance because transaction patterns can change over time.
This workflow demonstrates how data analytics can become part of a broader fraud-monitoring process.
Common Challenges in Banking Analytics
1. Highly Imbalanced Data
Fraud may represent only a small percentage of all transactions.
Solution: Use appropriate sampling, modeling, and evaluation techniques.
2. Changing Fraud Patterns
Fraudsters can adapt their methods.
Solution: Continuously monitor model performance and update analytical systems when appropriate.
3. False Alerts
Too many alerts can overwhelm investigators.
Solution: Carefully evaluate thresholds and model performance.
4. Data Privacy
Financial information is sensitive.
Solution: Apply strong security and governance controls.
5. Model Bias
Models can produce systematically different outcomes across groups if the data or modeling process contains problematic patterns.
Solution: Evaluate model performance across relevant populations and monitor for potential disparities.
6. Lack of Quality Labels
Fraud datasets may contain incomplete or delayed labels.
Solution: Improve investigation feedback loops and consider appropriate analytical approaches for limited labels.
Tools Used in Banking & Finance Analytics
Analysts can use a range of technologies depending on the size and complexity of the organization.
Spreadsheet Tools
Useful for:
- Basic calculations
- Data cleaning
- Small datasets
- Simple dashboards
SQL
Useful for:
- Extracting transaction records
- Joining financial datasets
- Aggregating customer activity
- Creating analytical datasets
Python
Useful for:
- Data cleaning
- Statistical analysis
- Machine learning
- Automation
- Visualization
Popular libraries include:
- pandas
- NumPy
- scikit-learn
- Matplotlib
R
Useful for:
- Statistical analysis
- Data visualization
- Modeling
- Research
Business Intelligence Tools
Tools such as Power BI and Tableau can help create dashboards for monitoring financial performance and risk indicators.
A Practical Analytics Workflow
A banking risk or fraud analytics project can follow this general process:
Define the Problem
↓
Collect Relevant Data
↓
Clean & Validate Data
↓
Explore Patterns
↓
Engineer Features
↓
Build Statistical/ML Model
↓
Evaluate Performance
↓
Validate Results
↓
Deploy or Integrate
↓
Monitor Continuously
The final step is particularly important.
A model that performs well today may not perform equally well months or years later because customer behavior, technology, economic conditions, and fraud strategies can change.
Final Thoughts
Banking and finance analytics plays an important role in understanding financial risk and detecting potentially suspicious activity.
From credit-risk analysis and loan-default prediction to anomaly detection and transaction monitoring, data allows financial institutions to analyze large volumes of information and identify patterns that may otherwise be difficult to detect.
However, successful analytics is not simply about choosing a sophisticated machine-learning algorithm.
It requires:
- High-quality data
- Appropriate statistical methods
- Careful feature engineering
- Meaningful evaluation metrics
- Privacy and security controls
- Model validation
- Continuous monitoring
- Human oversight where appropriate
The ultimate goal is to turn financial data into reliable information that supports responsible risk management and effective fraud monitoring.
As digital banking continues to expand, the ability to analyze financial data quickly and responsibly will remain an important part of modern banking and financial