
7 Mistakes to Avoid in Your Thesis
Regression analysis is one of the most powerful tools in academic research. Yet it is also one of the most misused. Every year, thousands of thesis submissions carry quietly flawed models p-values celebrated without context, assumptions skipped, and conclusions drawn from shaky foundations. If you are writing a quantitative thesis, this guide is your pre-submission checklist.
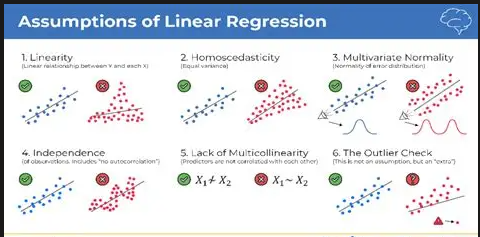
Ordinary Least Squares (OLS) regression rests on core assumptions linearity, independence, homoscedasticity, normality of residuals, and no multicollinearity. Most students run the model and jump straight to interpreting coefficients, never once testing whether these assumptions hold. A regression built on violated assumptions can produce completely misleading results even if the R² looks great.
Fix: Always run assumption diagnostics before interpreting anything. Residual plots, Breusch-Pagan tests for heteroscedasticity, and VIF scores for multicollinearity are non-negotiable steps.
Mistake 2: Treating p < 0.05 as the Holy Grail
Statistical significance is not the same as practical significance. A p-value below 0.05 only tells you that the result is unlikely under the null hypothesis it says nothing about whether the effect is meaningful, large, or useful in the real world. With a large enough sample, almost anything becomes statistically significant, including effects so tiny they are irrelevant to your research question.

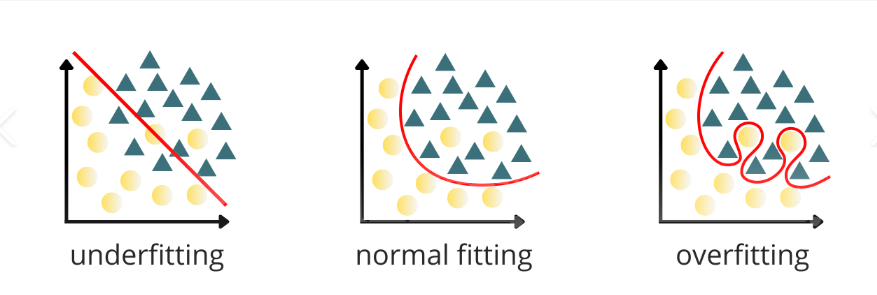
Mistake 3: Overfitting the Model with Too Many Predictors
Throwing every available variable into your model feels thorough but it is a trap. Overfitting occurs when your model learns the noise in your sample data instead of the underlying pattern. The result is a model that fits your dataset beautifully but generalizes terribly. Your committee will spot this if your adjusted R² drops significantly from your R², or if several predictors have inflated standard errors.
Fix: Follow the rule of thumb have at least 10–20 observations per predictor. Use theory to guide variable selection, not curiosity. Consider adjusted R², AIC, or BIC for model comparison.
Mistake 4: Confusing Correlation with Causation
These sounds obvious every methodology textbook warns against it yet it remains the most common interpretive error in thesis write-ups. Regression tells you about association, not causation. If you write ‘Variable X increases Variable Y,’ you have made a causal claim your model cannot support unless you have used experimental data or a proper causal inference design.
Fix: Use cautious language: ‘X is positively associated with Y,’ or ‘a one-unit increase in X is related to a β-unit change in Y.’ If causality is your goal, discuss the conditions required for causal interpretation explicitly.
Mistake 5: Mishandling Outliers and Influential Points
Outliers do not just skew your means in regression, a single influential observation can dramatically pull your entire regression line. Many students either ignore outliers entirely or delete them without justification, both of which are problematic. Outliers might be data entry errors, legitimate extreme values, or your most interesting findings.
Fix: Use Cook’s Distance and leverage plots to identify influential points. Report your outlier decision transparently did you remove them? Why? Run your analysis both with and without them and compare results.
Mistake 6: Neglecting Multicollinearity Between Predictors
When two or more of your independent variables are strongly correlated with each other, your model suffers from multicollinearity. The individual coefficient estimates become unstable and unreliable small changes in the data produce wildly different coefficients. The model might still predict well, but you can no longer trust the interpretation of individual predictors, which is usually the entire point of a thesis model.
Fix: Calculate Variance Inflation Factors (VIF) for all predictors. A VIF above 5 (conservative) or 10 (liberal threshold) signals a problem. Consider dropping one of the correlated variables, combining them, or using Ridge regression.
Mistake 7: Failing to Validate the Model
Building a model is only half the job. A model that has not been validated is just an optimistic guess. Cross-validation, holdout samples, or out-of-sample testing reveal how well your model performs on data it has not seen which is the actual measure of its worth. Most thesis students report in-sample fit statistics and call it done, leaving the model’s real-world credibility completely unknown.
Fix: If your dataset is large enough, split it into training and testing sets (e.g., 80/20). If not, use k-fold cross-validation. Report both in-sample and out-of-sample performance metrics clearly.
Bottom Line
A regression model is only as credible as the care taken to build it. The most impressive-looking output means nothing if the foundations are shaky. Before you submit, run your diagnostics, check your assumptions, and write with the epistemic humility your data actually deserves. Your thesis examiner almost certainly knows these pitfalls the question is whether you do too.